Splunk and New Relic are both popular observability / monitoring tools, but they were designed with different core strengths. The easiest way to understand them is:
Splunk → log analytics + security + data platform
New Relic → application performance monitoring (APM) + full-stack observability
Sources note that Splunk excels at log analytics and security, while New Relic focuses more on monitoring application performance and user experience.
Architecture focus
Splunk
Built to ingest and analyze machine-generated data
Strong log indexing and search
Commonly used for:
Security monitoring (SIEM)
Incident investigation
Compliance auditing
Infrastructure monitoring
It can ingest and analyze almost any log or event data source for troubleshooting and analytics.
New Relic
Designed primarily for APM (Application Performance Monitoring)
Gives deep insight into:
Application response times
Distributed tracing
User experience
Infrastructure metrics
It provides full-stack observability across apps, infrastructure, and networks with dashboards and alerts.
Typical use cases
Choose Splunk if you need
Security monitoring (SIEM)
Advanced log analytics
Investigating incidents across large datasets
Hybrid environments (cloud + on-prem)
Example teams:
Security operations
Compliance
Enterprise IT ops
Choose New Relic if you need
Application performance monitoring
Distributed tracing
Cloud-native monitoring
Developer-friendly observability
Example teams:
Developers
DevOps / SRE
SaaS startups
Quick example
Imagine a slow web application.
New Relic
Shows which service is slow
Displays distributed traces
Shows database query latency
Splunk
Lets you search logs
Correlate events across systems
Investigate root cause from log data
Simple summary
If your focus is…
Choose
Application performance
New Relic
Log analytics & security
Splunk
Developer observability
New Relic
Enterprise monitoring + SIEM
Splunk
Splunk – Simple Overview
Splunk is a software platform used to collect, analyze, and visualize machine data and big data.
Machine data is generated by systems such as:
Servers and CPUs
Websites and applications
IoT devices
Mobile apps
System and application logs
This data usually does not have direct business meaning, but it is very useful for:
Monitoring systems
Detecting problems
Improving performance
Security analysis
Splunk can process unstructured, semi-structured, and structured data, then allow users to search, analyze, and visualize insights using reports and dashboards.
Over time, Splunk has evolved from a simple log analysis tool into a powerful big data analytics platform.
Splunk Product Categories
Splunk Enterprise Used by organizations with large IT infrastructures to collect and analyze data from applications, websites, devices, and sensors.
Splunk Cloud Cloud-hosted version of Splunk Enterprise, available directly from Splunk or through AWS.
Splunk Light A simplified version that provides basic search, reporting, and alerting for log data.
Key Features of Splunk
Data Ingestion – Collects data from multiple formats like JSON, XML, and logs.
Data Indexing – Organizes data for faster searching.
Data Searching – Allows analysis to find patterns, trends, and metrics.
Alerts – Sends notifications (email/RSS) when specific conditions occur.
Dashboards – Displays results through charts, reports, and visualizations.
Data Models – Structures data to make analysis easier for users.
Splunk is a data analytics platform that collects, searches, analyzes, and visualizes machine data to monitor systems and gain insights.
Select the .deb package (used for Ubuntu/Debian systems).
Click Download Now.
Log in or create a Splunk account if prompted.
The Splunk Enterprise .deb installer will start downloading.
The .deb file is the installation package used by Ubuntu, similar to .exe files in Windows.
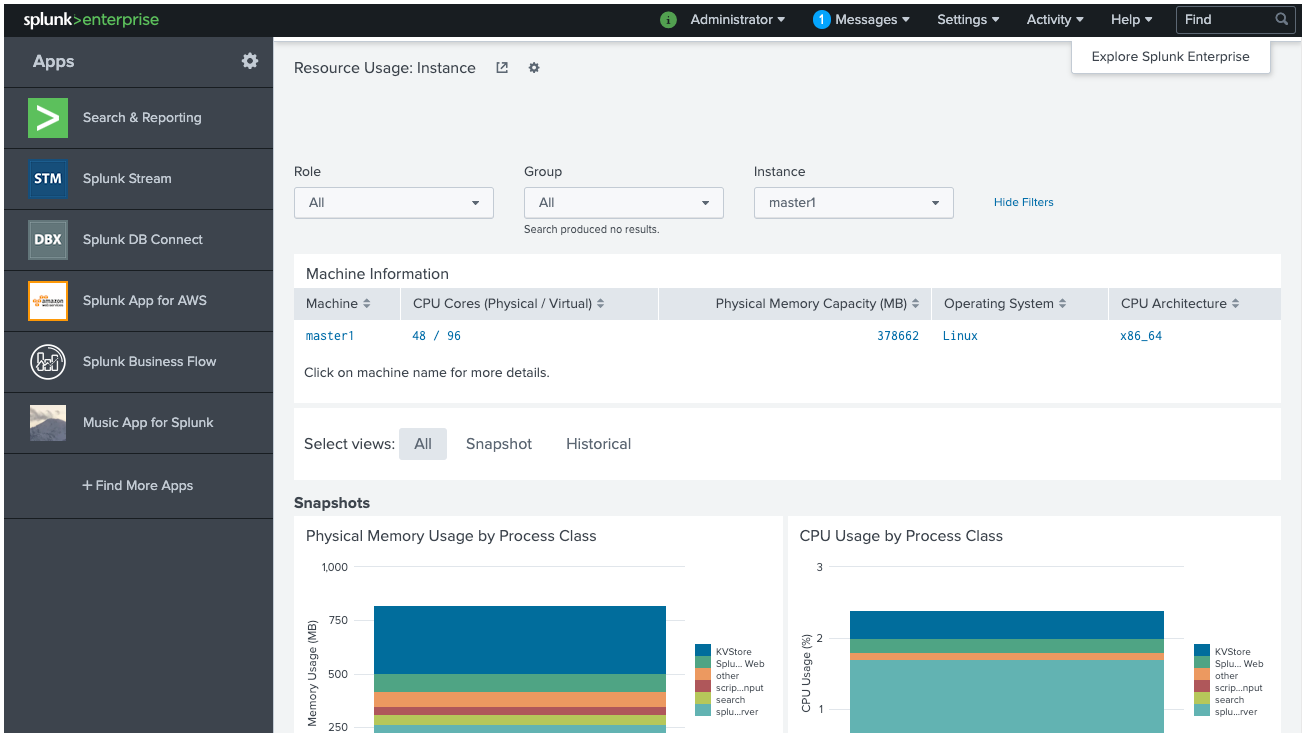
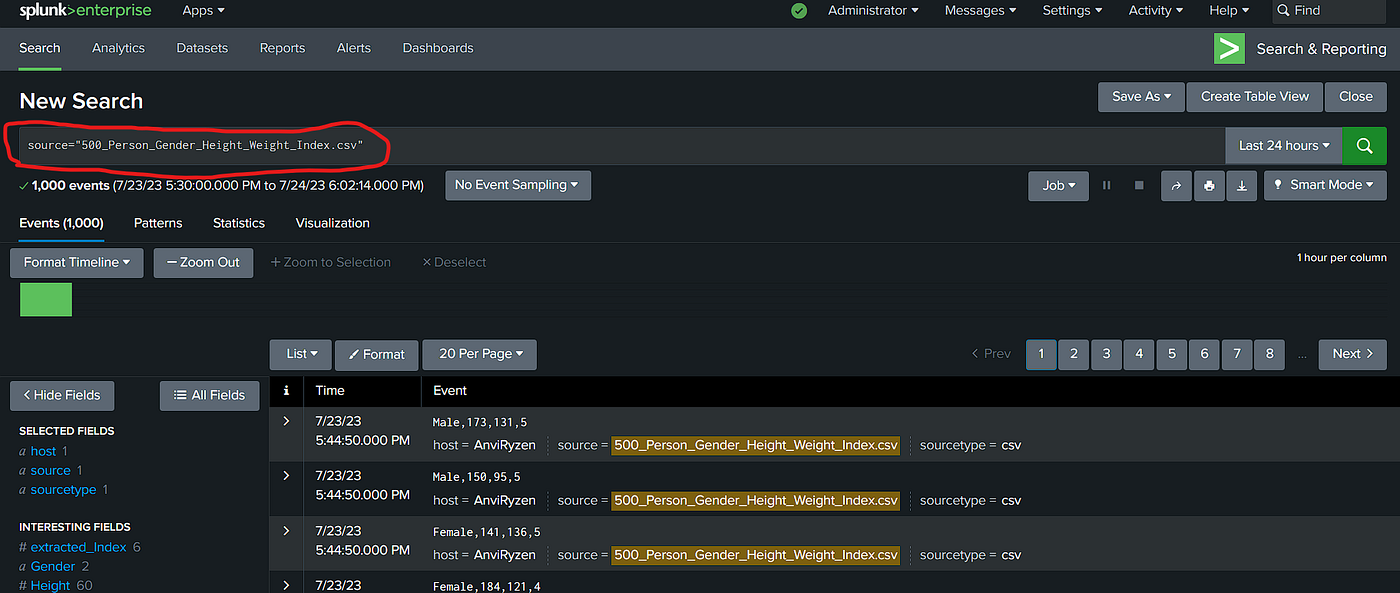
Splunk – Web Interface Overview
The below picture shows the initial screen after your login to Splunk with the admin credentials.
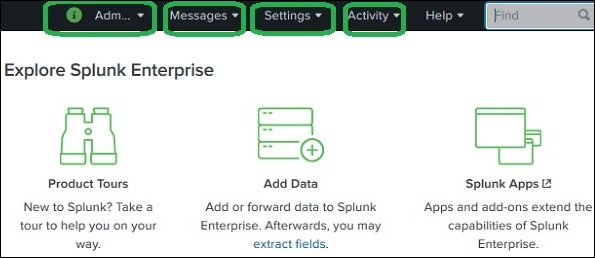
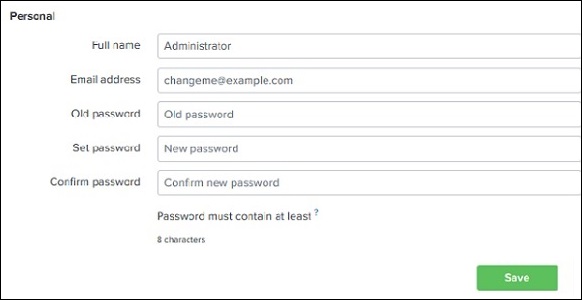
Administrator Link
The Administrator dropdown allows management of the admin account.
Using this option you can:
Change admin email ID
Reset or update admin password
Manage account settings
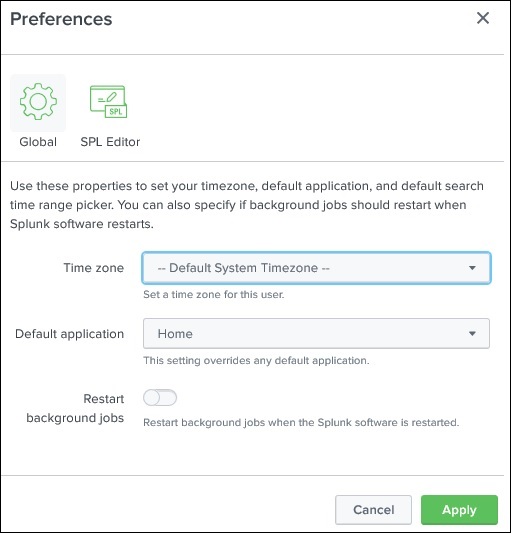
It also provides access to Preferences, where you can:
Set the time zone
Select the default home application
Customize the landing page after login
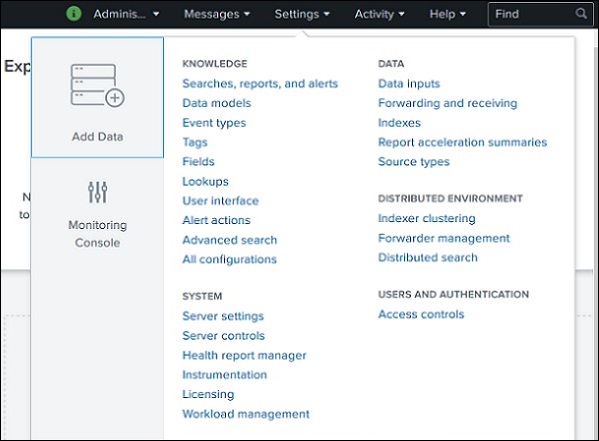
Settings Link
The Settings menu contains most of the core configuration features of Splunk.
From here you can:
Manage data inputs
Create lookup files and lookup definitions
Configure users, roles, and authentication
Manage indexes and apps
Configure alerts and data models
This section is mainly used for administration and system configuration.
Search and Reporting Link
The Search & Reporting app is the most commonly used area in Splunk.
It allows users to:
Search ingested data
Create reports and alerts
Build visualizations and dashboards
Analyze logs and machine data
Users write Splunk Search Processing Language (SPL) queries here to analyze data.
The Splunk Web Interface is a browser-based platform where users can search data, create reports, configure alerts, and manage system settings and users.
It includes key sections such as Administrator, Settings, and Search & Reporting.
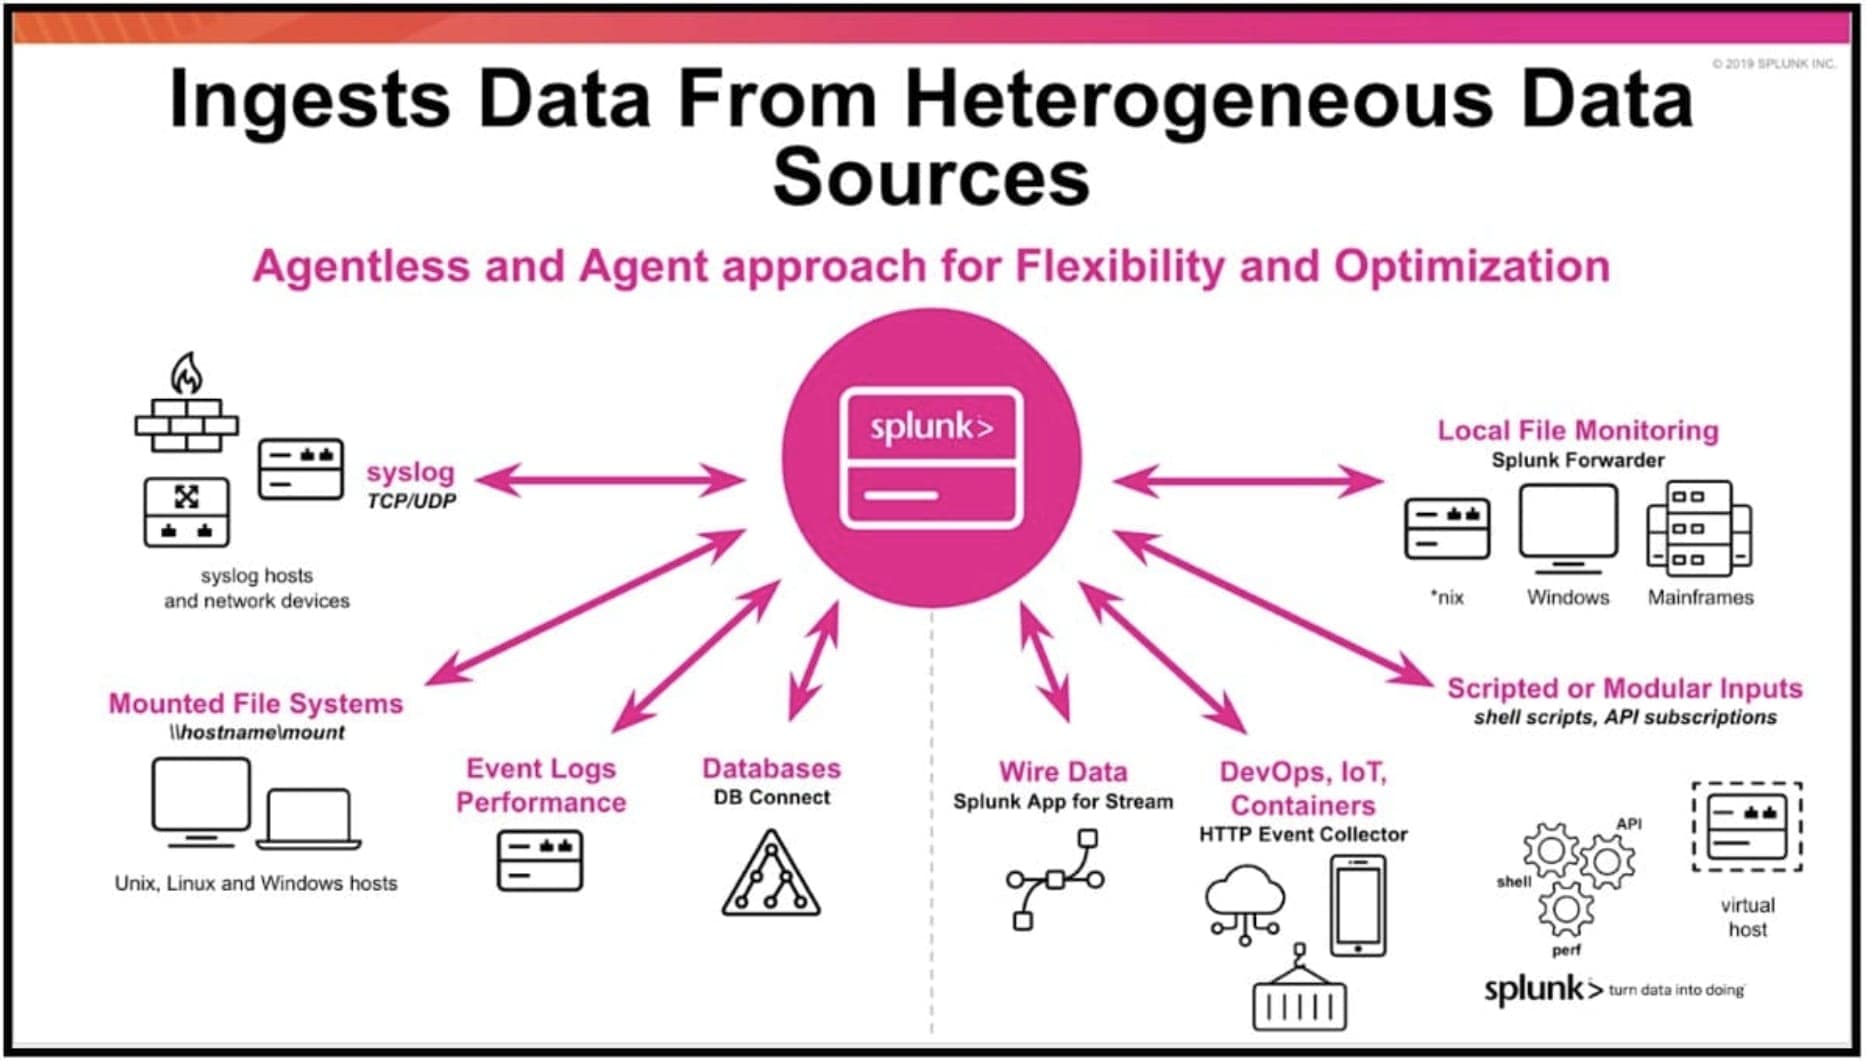
Splunk – Data Ingestion (Simple Explanation)
Data Ingestion in Splunk means importing or loading data into Splunk so that it can be searched, analyzed, and visualized.
This process is done using the Add Data option available in the Search & Reporting App.
Steps for Data Ingestion in Splunk
Add Data
After logging in to Splunk:
Go to the Home screen
Click the Add Data icon
This opens the data upload wizard where you select the data source.
Gather the Data
You need a dataset to upload into Splunk.
Example:
Download sample datasets from the Splunk official website
Extract the downloaded file
The folder may contain files like:
secure.log
other log files generated by web applications
These log files simulate machine data for analysis.
Upload Data
Select the file (example: secure.log) from your system
Click the Next button to continue.
This uploads the file into the ingestion pipeline.
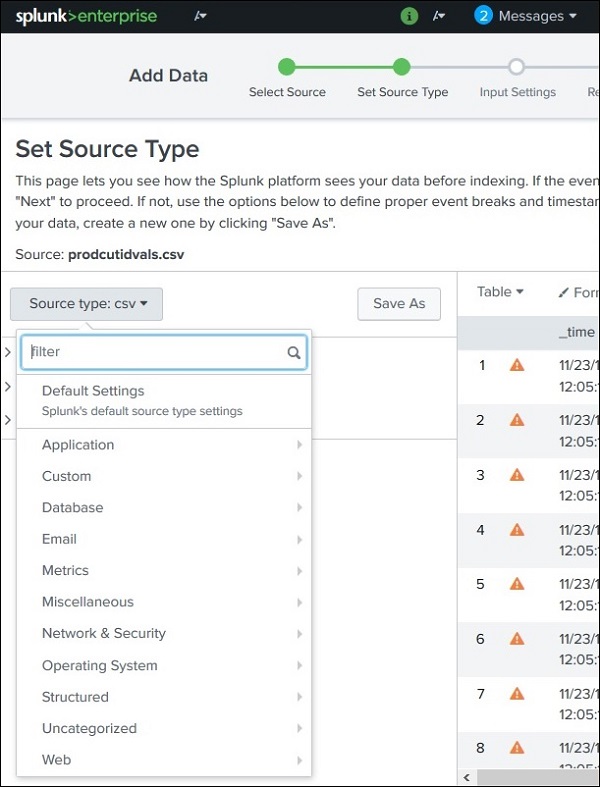
Select Source Type
Splunk automatically detects the data format.
Common source types include:
System logs
Web logs
JSON
XML
You can:
Use the default source type, or
Manually select a different type from the dropdown list.
nput Settings
Here you configure host information for the data.
Options include:
Constant Value
Specify the full host name of the machine generating the data.
Regex on Path
Use a regular expression to extract the host name.
Segment in Path
Extract host name from a specific path segment. Example: /var/log/server1/logfile
You also choose an Index Type:
Default Index – stores raw data for searching.
Summary Index – stores aggregated summary data.
History Index – stores search history.
Review Settings
Splunk shows a summary of all selected settings.
You should:
Review the configuration
Click Next to confirm.
Data Ingestion Completed
After finishing:
Splunk confirms successful data ingestion
You can now:
Search the data
Create reports
Build dashboards
Set alerts
Splunk – Source Types (Simple Explanation)
What is a Source Type in Splunk?
A Source Type in Splunk defines the format and structure of incoming data.
When data is ingested into Splunk, the data processing engine automatically analyzes the data and assigns it a source type. This process is called Source Type Detection.
This helps Splunk:
Understand the structure of the data
Extract relevant fields automatically
Make the data easier to search and analyze
Example: If Splunk receives a log file from an Apache web server, it automatically identifies it and applies the Apache log source type.
Supported Source Types
When uploading data using the Add Data feature:
Upload a file.
Open the Source Type dropdown.
You will see many supported source types.
These include formats such as:
Logs
CSV files
JSON
XML
Database logs
Application logs
Source Type Sub-Categories
Each source type category can have multiple sub-categories.
Example:
Database category
MySQL logs
Oracle logs
PostgreSQL logs
Splunk can recognize these formats and automatically extract useful fields.
Important Pre-Trained Source Types
Splunk includes many pre-trained source types, meaning it already knows how to interpret certain log formats.
Source Type
Description
access_combined
HTTP web server logs in NCSA combined format
access_combined_wcookie
Same as combined logs but with cookie information
apache_error
Apache web server error logs
linux_messages_syslog
Linux system log messages
log4j
Logs generated by applications using Log4j
mysqld_error
MySQL database error logs
A Source Type in Splunk identifies the format of incoming data, allowing Splunk to automatically classify logs and extract useful fields, making analysis faster and easier.
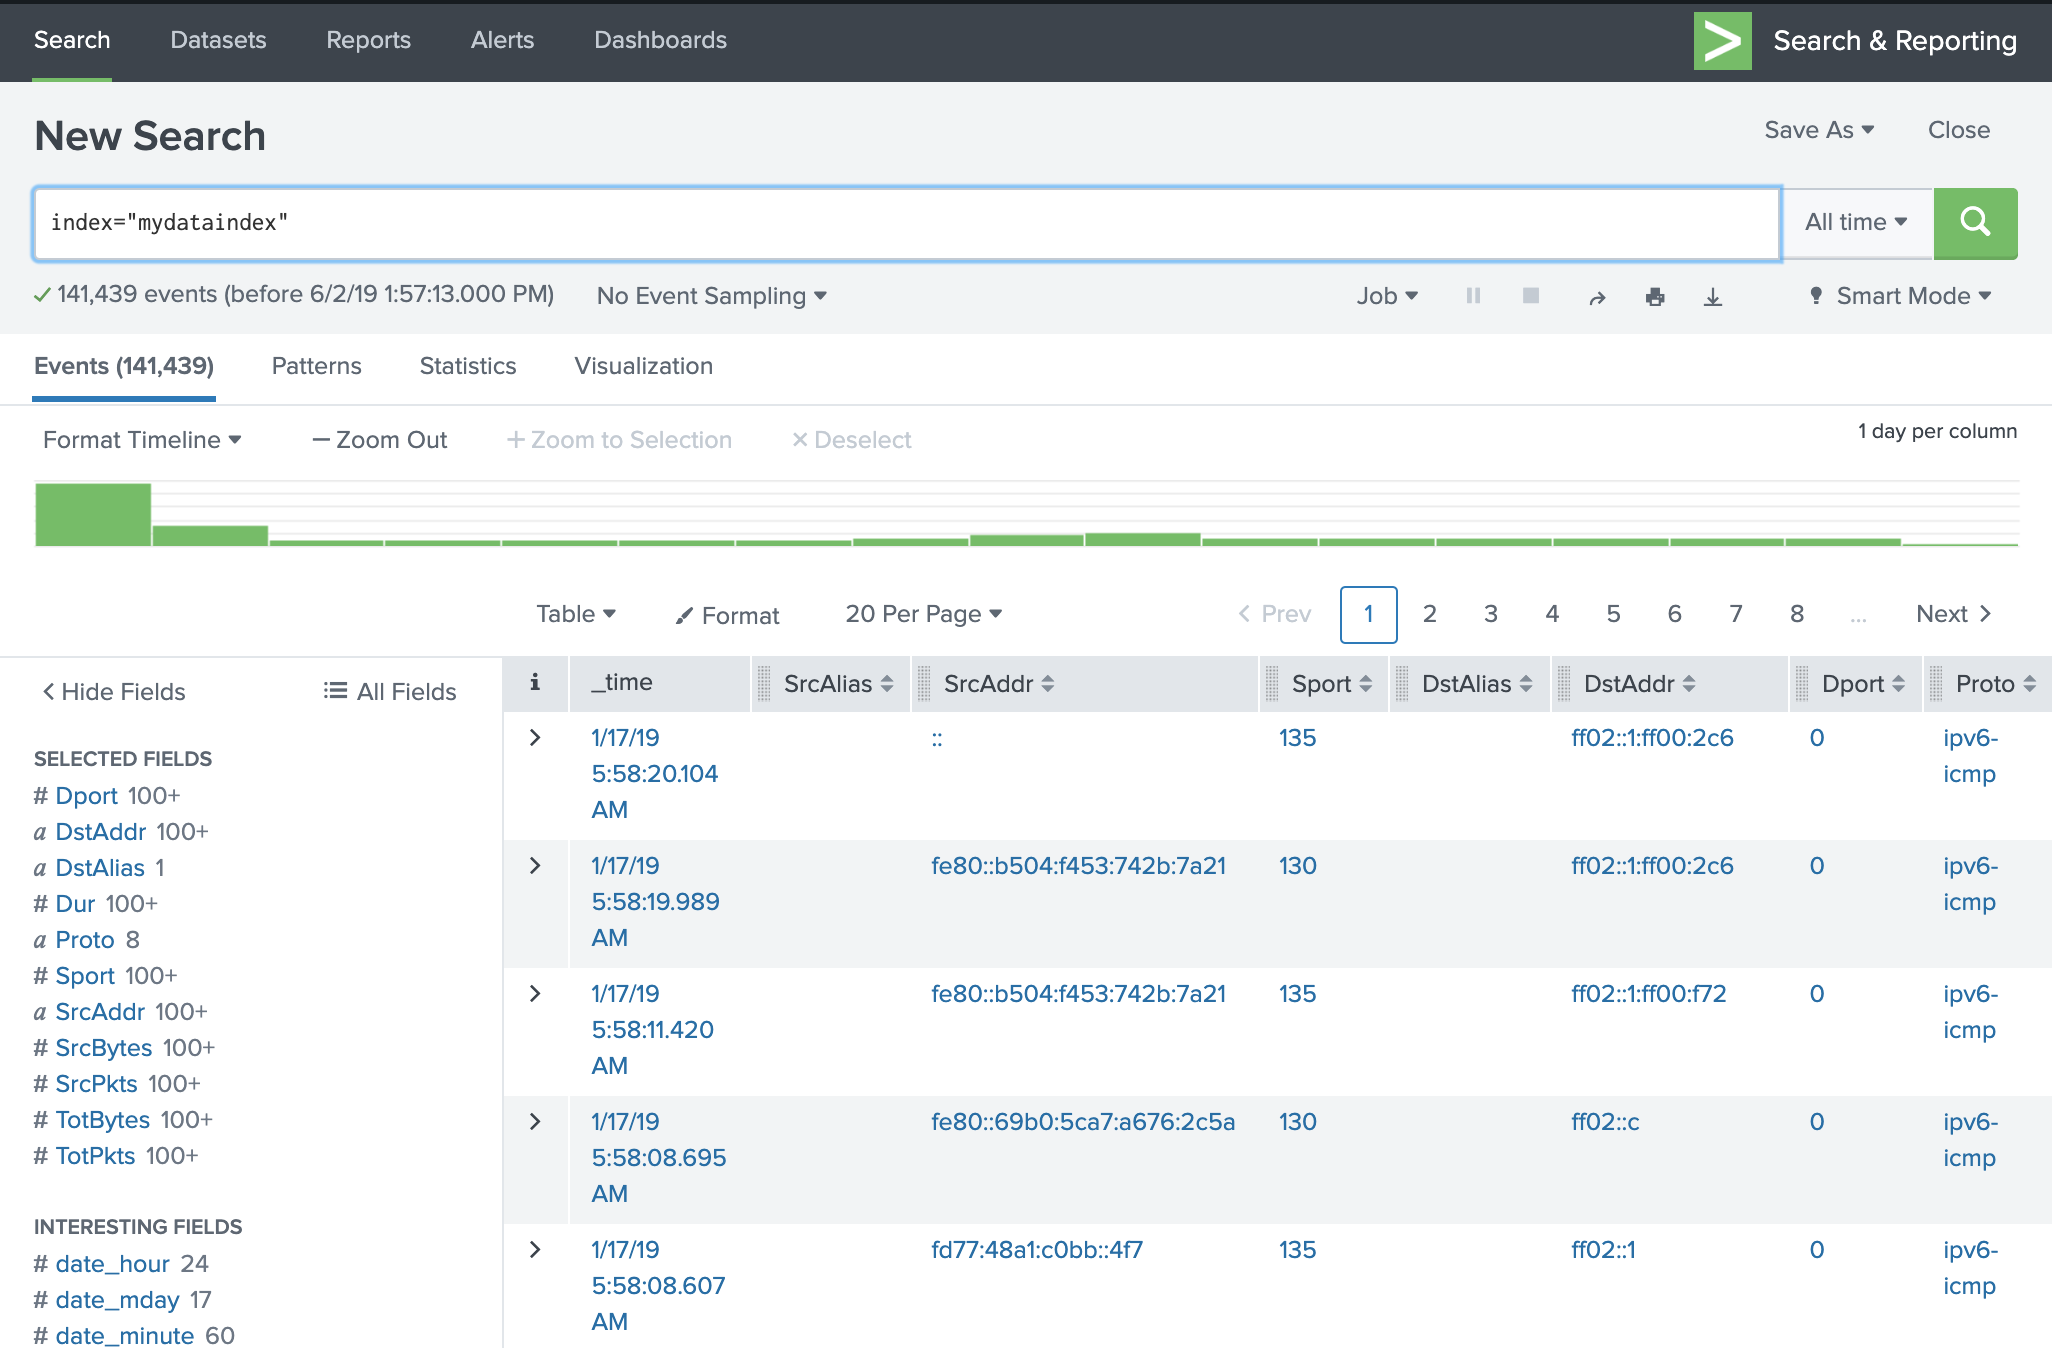
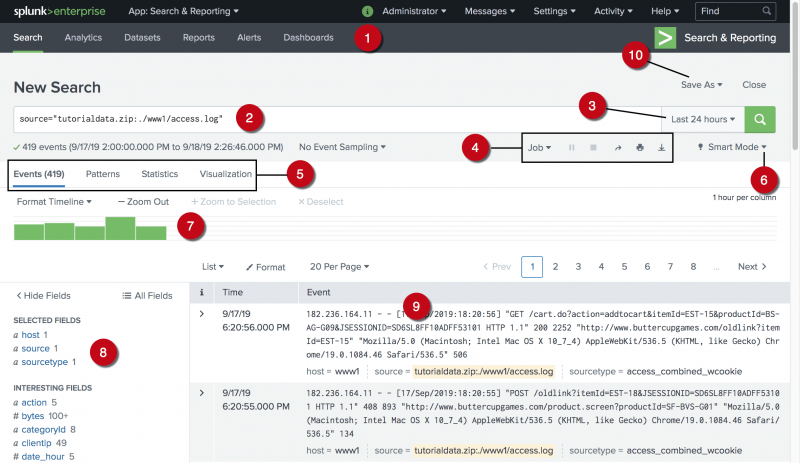
Splunk – Basic Search
What is Basic Search in Splunk?
Basic Search in Splunk allows users to find specific information from the ingested data (such as log files, system events, or machine data).
Splunk uses a Search Processing Language (SPL) to perform searches. With SPL, you can filter, combine, and analyze log data quickly.
The search feature is available in the Search & Reporting App in the Splunk web interface.
How to Perform a Basic Search
Open Search & Reporting
After logging in to Splunk:
Go to the left sidebar.
Click Search & Reporting.
A search bar will appear where you can type search queries.
This is the main place where data analysis begins in Splunk.
Searching for a Single Term
You can search for a specific term present in the log data.
Example:
host=server1
This query will show all log events generated from the host named "server1".
Results appear in:
Events list (individual log entries)
Timeline chart showing event distribution over time.
Combining Search Terms
You can combine multiple terms to make the search more specific.
Example:
"login failed"
Using double quotes (" ") searches for the exact phrase.
Example result:
Only log entries that contain login failed together will appear.
Using Wildcards
Wildcards help search for multiple variations of a word.
Example:
fail* AND password
Here:
fail* matches words like:
fail
failed
failure
AND ensures the event must also contain password.
Other operators include:
AND – both terms must exist
OR – either term can exist
NOT – excludes a term
Example:
error OR failure
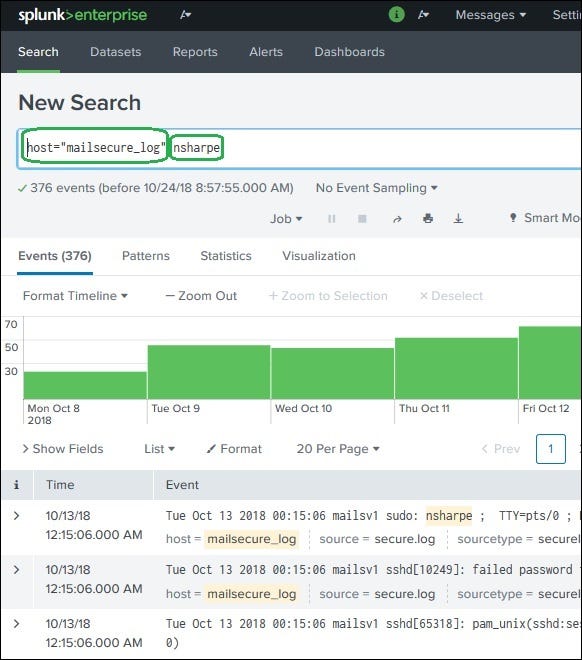
Refining Search Results
Splunk allows you to narrow down results directly from the event list.
Steps:
Click a value in the search results (for example 3351).
Select Add to Search.
Splunk automatically adds it to the query.
Example refined query:
host=server1 3351
Now only events containing 3351 will be displayed.
Also:
The timeline graph updates automatically to reflect filtered results.
Key Components in Search Results
Timeline
Shows the number of events over time.
Events List
Displays individual log entries.
Fields Panel
Shows extracted fields from the data.
Basic Search in Splunk allows users to query ingested data using keywords or SPL queries. Users can combine terms, use wildcards, apply operators, and refine results to analyze log data efficiently.
Splunk – Field Searching
What is Field Searching in Splunk?
When Splunk ingests machine data (like log files), it automatically analyzes the data and breaks it into fields. A field represents a single piece of information from an event.
Example fields from a log record:
host – server name
timestamp – time when event occurred
event type – login attempt, HTTP request, error, etc.
user – username involved
status – success or failure
Even if the data is unstructured, Splunk tries to extract key-value pairs and separate them based on:
Strings
Numbers
Dates
This automatic process is called Field Extraction.
Viewing Fields
After running a search in Splunk:
Click Show Fields in the search results page.
Splunk opens the Fields sidebar.
It displays all the fields extracted from the uploaded data (for example from secure.log).
Each field represents a column of information within the events.
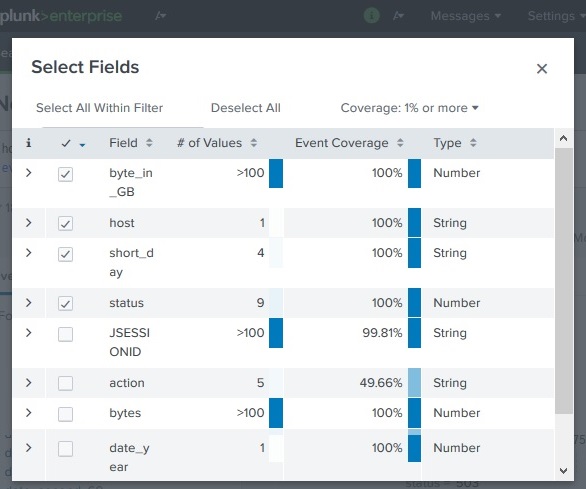
Choosing Fields to Display
You can control which fields appear in the search results.
Steps:
Click All Fields.
A list of available fields appears.
Select or deselect fields using checkboxes.
For every field Splunk also shows:
Number of distinct values
Data type (string, number, etc.)
Event coverage (%) – how many events contain that field.
This helps users understand how important or common a field is in the dataset.
Field Details
If you click on a field name, Splunk shows a Field Summary.
The summary includes:
All distinct values of that field
Count of each value
Percentage distribution
Example: Field: status
Value
Count
Percentage
success
120
60%
failure
80
40%
This helps identify patterns and trends quickly.
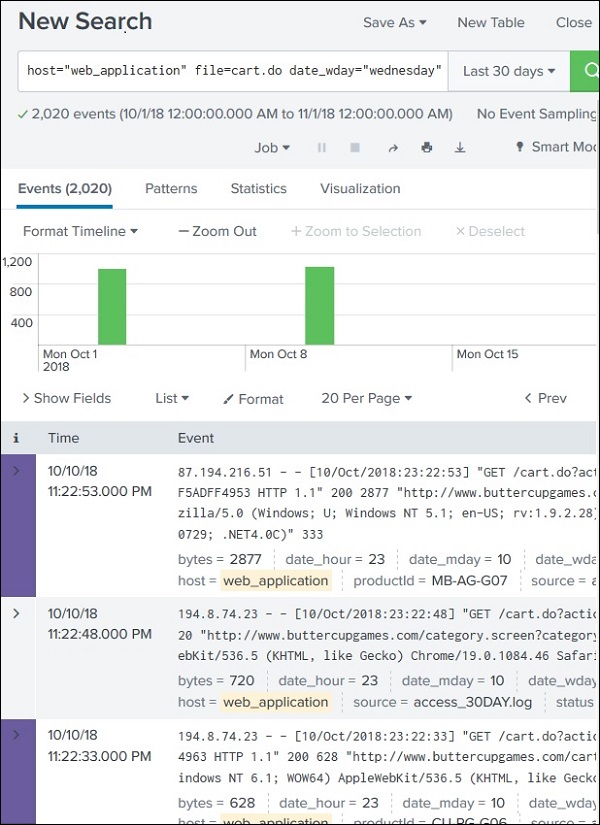
Using Fields in Search Queries
Fields can also be used directly in the search query to filter results.
Example:
host=mailsecure_log date="15 Oct"
This query returns all events generated on 15th October from the host mailsecure_log.
Another example:
status=failed user=root
This search shows failed login attempts for the root user.
Field Searching in Splunk allows users to analyze specific parts of log data by using automatically extracted fields such as host, timestamp, user, and event type, making searches more precise and efficient.
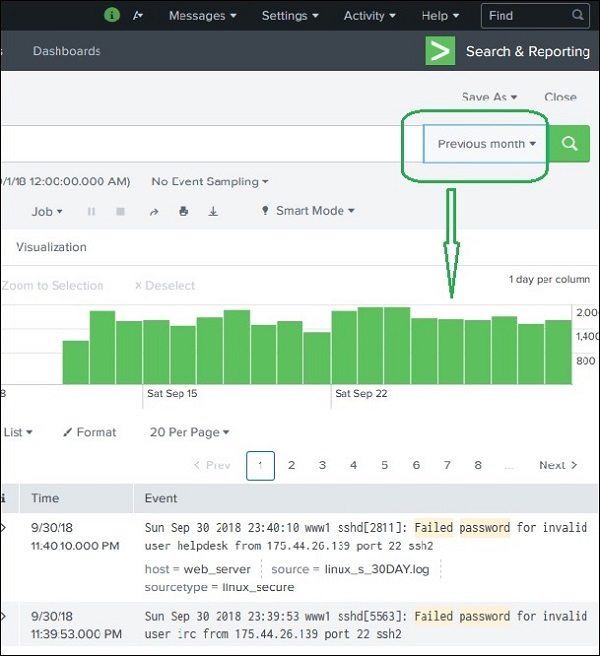
Splunk – Time Range Search
What is Time Range Search?
In Splunk, Time Range Search allows users to filter and analyze events based on a specific time period.
Every search result page in Splunk shows a timeline graph at the top. This graph displays how events are distributed across time.
Using this timeline, users can limit their search results to a specific time range, making analysis faster and more accurate.
Preset Time Range Options
Splunk provides predefined time ranges that can be selected easily.
Common preset options include:
Last 15 minutes
Last 60 minutes
Last 24 hours
Last 7 days
Previous week
Previous month
Example: If you select Previous Month, Splunk will display only the events that occurred during the previous month.
The timeline graph updates automatically to show events for that selected period.
Selecting a Time Subset
You can also manually select a portion of time from the timeline graph.
Steps:
Click on the timeline graph.
Drag across the bars representing event counts.
Splunk filters results for that selected time interval.
Important:
This does not re-run the query.
It only filters the already returned results.
This method is useful for quick analysis of specific time spikes.
Using Earliest and Latest Commands
Splunk also allows time filtering directly through search commands.
Two important commands are:
earliest
latest
Example:
earliest=-15d latest=-7d
Meaning:
Show events from 15 days ago to 7 days ago.
This method provides more precise control compared to manual timeline selection.
Nearby Events
Splunk can also display events occurring near a specific time.
Users can specify the time interval scale, such as:
Seconds
Minutes
Hours
Days
Weeks
Example use case:
Investigating events occurring just before or after a system failure.
This helps identify related events around the same time period.
Time Range Search in Splunk allows users to analyze log events within a specific time period using preset time ranges, timeline selection, or commands like earliest and latest.
Overview
In Splunk, when you run a search query, the result is saved as a search job on the Splunk server. These jobs can be shared with other users or exported as files so that the results can be used outside Splunk.
This feature helps teams collaborate and reuse search results without running the same query again.
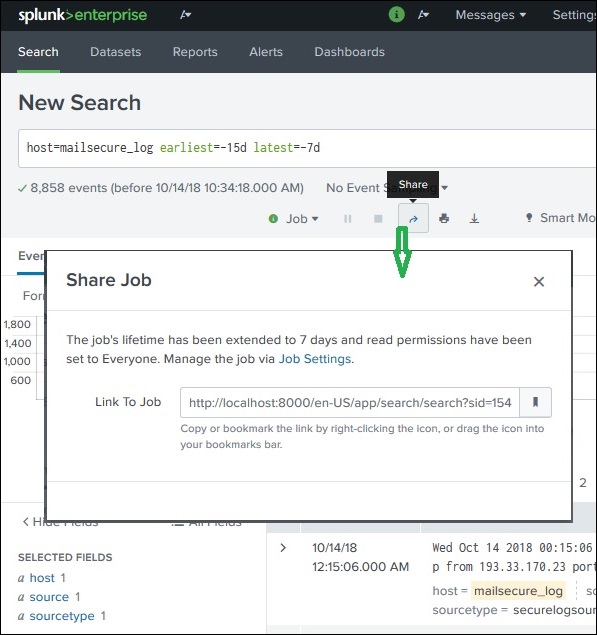
Sharing the Search Result
After a search query finishes:
Look at the top-right area of the search page.
Click the Share icon (upward arrow).
Splunk generates a URL link for that search job.
Using this link:
Other users can open the same search result.
They do not need to write or run the query again.
Important:
Users must have permission to access the shared result.
Permissions are managed through the Splunk Administration settings.
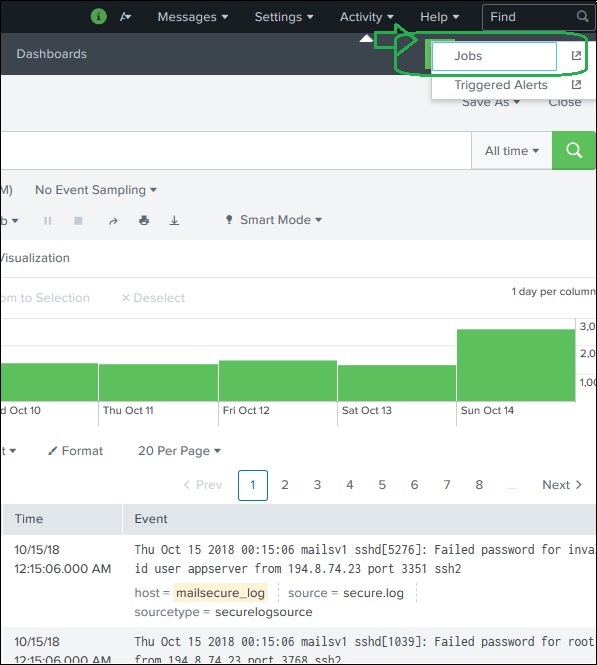
Finding Saved Search Jobs
All executed searches are stored as jobs in Splunk.
To view them:
Go to the Activity Menu (top-right of the interface).
Click Jobs.
Splunk shows a list of saved search jobs.
Each job includes:
Search query
Owner (user who ran it)
Execution time
Expiration date
Managing Job Expiration
Search jobs expire automatically after a certain time to save server resources.
If you want to keep the results longer:
Select the job from the jobs list.
Click Edit Selected.
Choose Extend Expiration.
This keeps the job available for future use.
Exporting Search Results
Splunk also allows exporting search results into files.
Steps:
Run a search query.
Click the Export button.
Choose a file format.
Available formats:
CSV – used for spreadsheets like Excel
XML – structured data format
JSON – commonly used for APIs and applications
After selecting the format, the file is downloaded to your local system.
This allows results to be shared with people who do not use Splunk.
→ Splunk allows users to share search results through links or saved jobs, and also export results as CSV, XML, or JSON files for external use and collaboration.
Splunk – Search Processing Language (SPL)
What is SPL?
SPL (Search Processing Language) is the language used in Splunk to search, filter, and analyze data.
It allows users to:
Retrieve data from logs
Filter results
Perform calculations
Group and transform data
SPL queries are written in the search bar of the Search & Reporting app.
A typical SPL query uses a pipeline structure (|), where each command processes the result from the previous command.
Example:
error | head 3
This search finds events containing error and then shows only the first 3 results.
Components of SPL
SPL consists of four main components:
Search Terms
Commands
Functions
Clauses
Search Terms
Search terms are the keywords or phrases used to retrieve data from Splunk.
Example:
login failed
This query returns all events containing the words login and failed.
You can also search specific fields.
Example:
host=server1
This shows events generated from server1.
Commands
Commands tell Splunk what action to perform on the search results.
Commands are separated by the pipe symbol |.
Example:
error | head 3
Explanation:
error → search term
| head 3 → command showing only the first 3 results
Common commands include:
head – shows first few results
table – displays selected fields
stats – performs statistical calculations
sort – sorts the results
top – shows most frequent values
Functions
Functions perform calculations on fields in the dataset.
These are commonly used with commands like stats.
Example:
| stats avg(bytes)
Explanation:
avg() calculates the average value of the field bytes.
Other common functions:
sum() – total value
count() – number of events
max() – maximum value
min() – minimum value
Example:
| stats count
This counts the total number of events.
Clauses
Clauses help organize and rename results.
Common clauses include:
by – groups results
as – renames fields
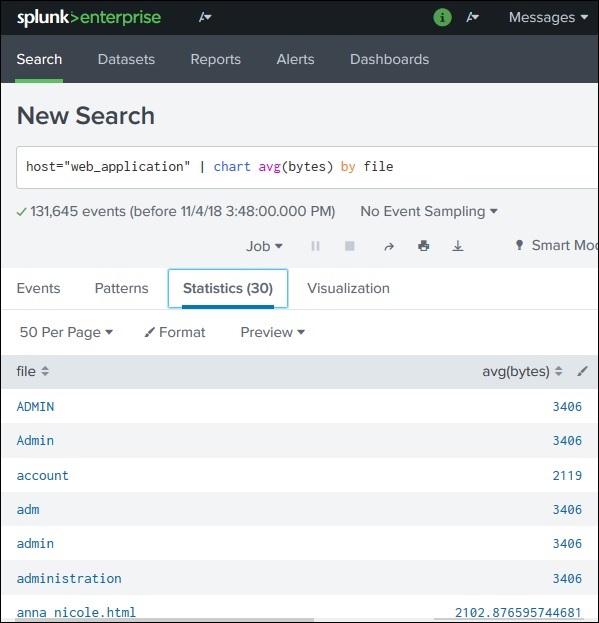
Example:
| stats avg(bytes) by file
Meaning:
Calculate average bytes
Group results by file name
Example with rename:
| stats avg(bytes) as Avg_Size by file
Result:
Each file
Its average size
SPL (Search Processing Language) is the query language used in Splunk to search and analyze machine data. It includes search terms, commands, functions, and clauses to filter, calculate, and organize data results.
Splunk – Search Optimization
What is Search Optimization?
Search Optimization in Splunk improves the speed and efficiency of search queries automatically.
Splunk has built-in optimization mechanisms that analyze the query and adjust the search process so that results are returned faster and with less resource usage.
The two main optimization goals are:
Early Filtering
Parallel Processing
Early Filtering
Early filtering means removing unnecessary data as early as possible during the search process.
Instead of processing all events, Splunk first filters out irrelevant events.
Benefits:
Reduces amount of data processed
Improves search performance
Avoids unnecessary calculations like lookups and evaluations
Example search:
fail OR failed OR password
Splunk first filters events containing these keywords before applying further processing.
Parallel Processing
Splunk uses multiple indexers to process searches simultaneously.
Steps:
Search query is sent to indexers.
Indexers process parts of the data in parallel.
Processed results are sent to the Search Head.
The Search Head combines and displays the final results.
Benefits:
Faster search execution
Better performance for large datasets
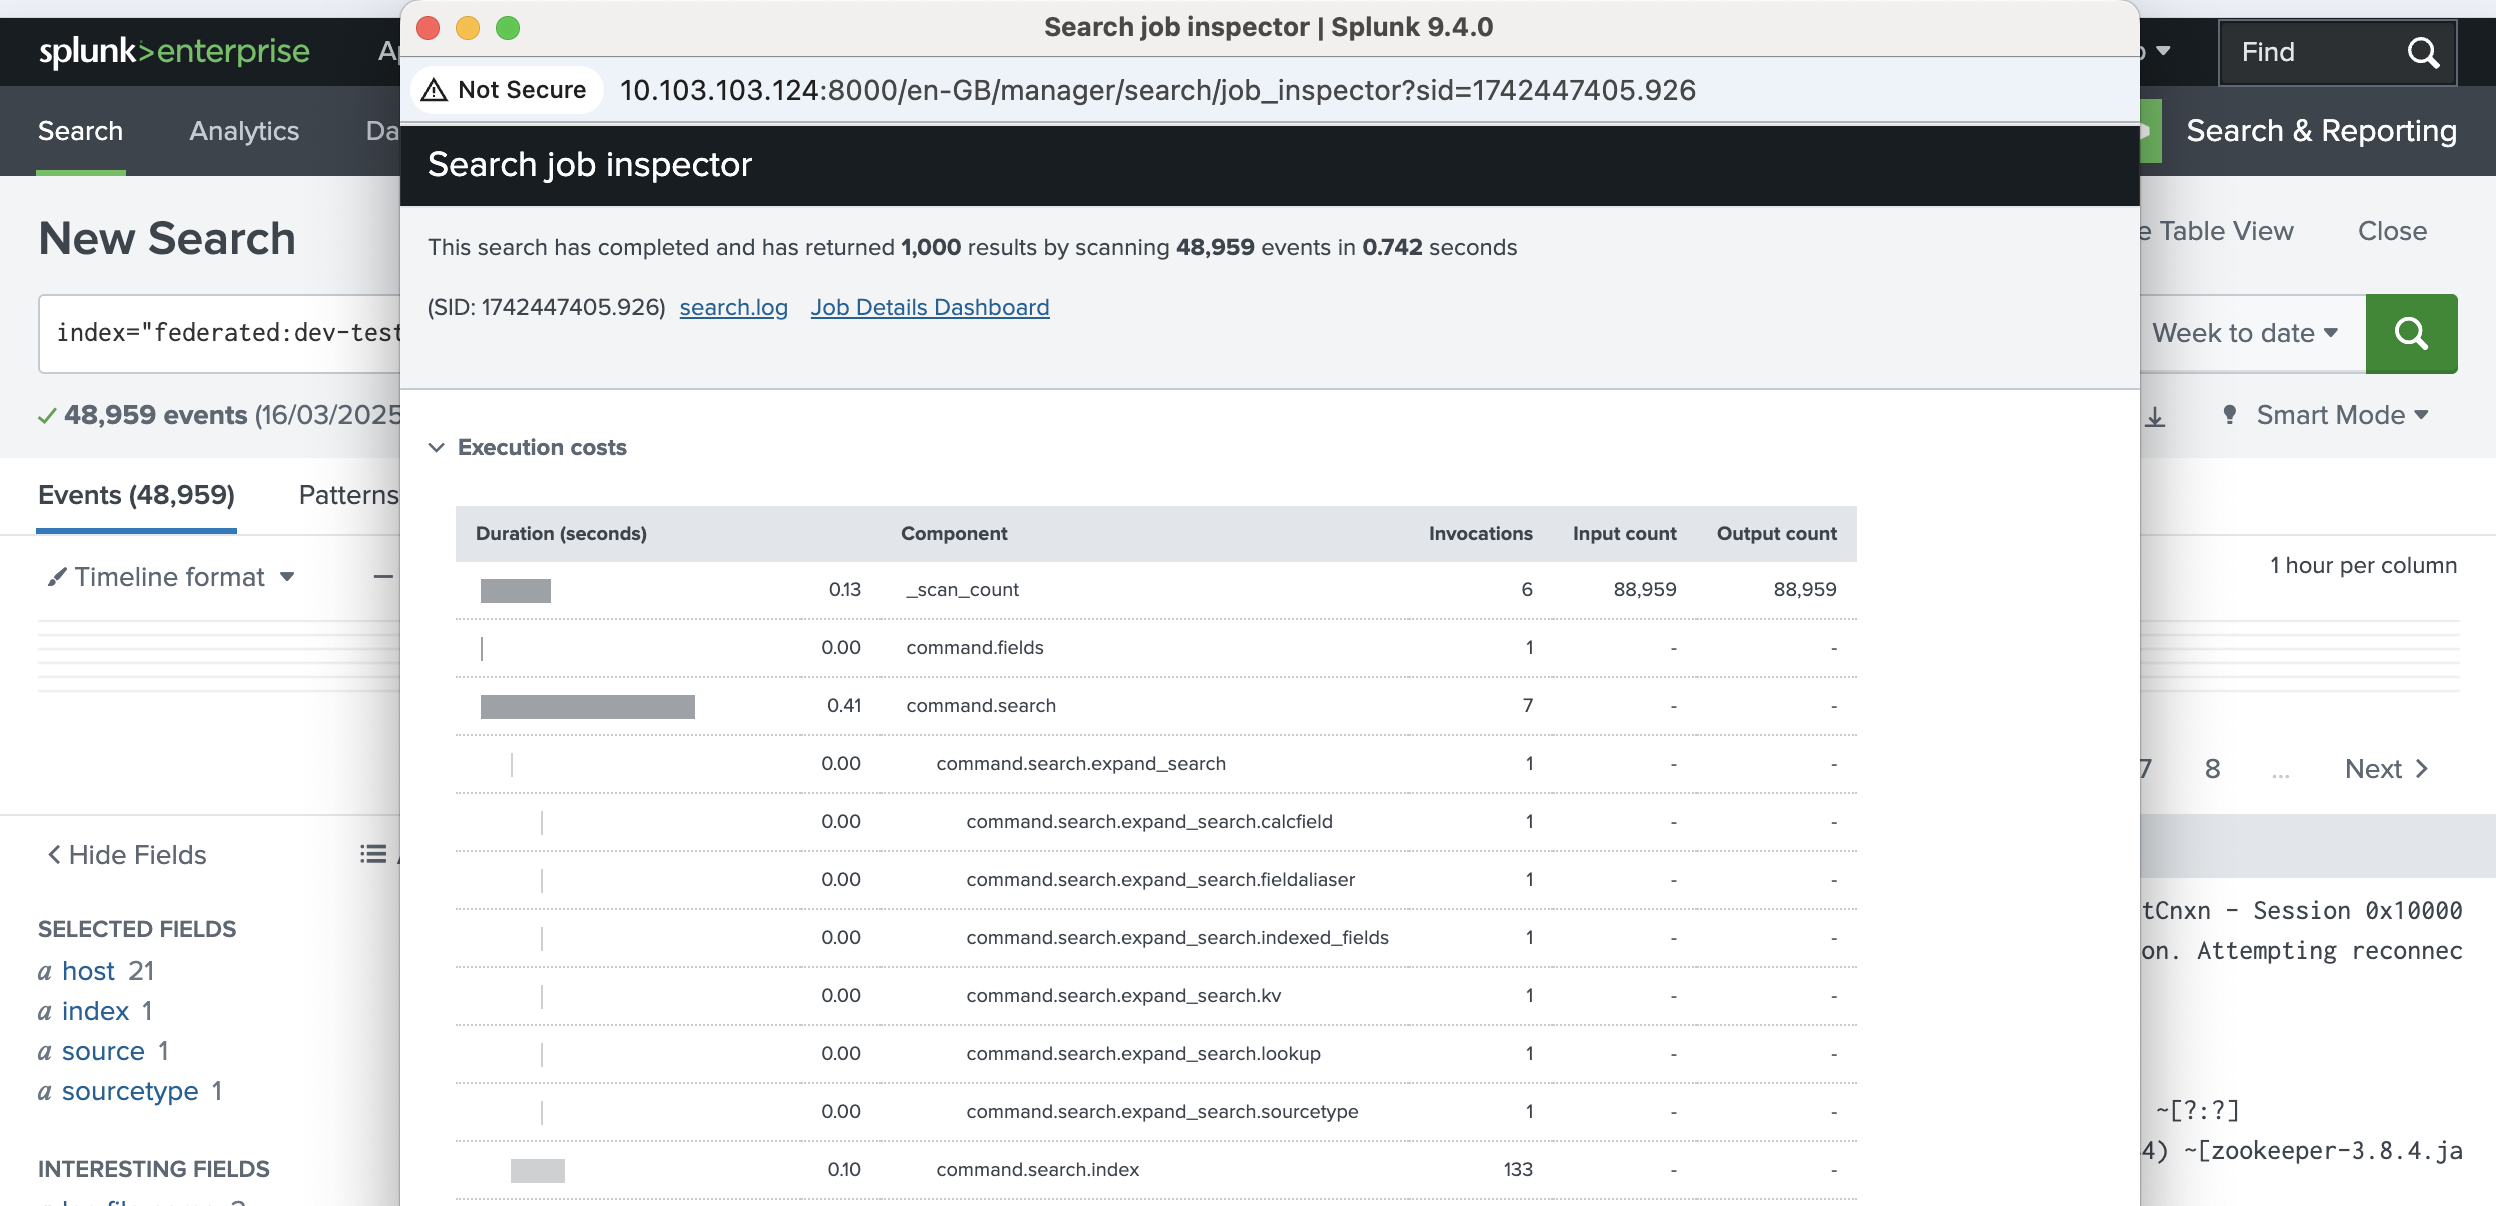
Analyzing Search Optimization
Splunk provides a tool called Job Inspector to analyze how a search was optimized.
Steps to access it:
Run a search query.
Click Search.
Go to Job.
Select Inspect Job.
The Job Inspector shows:
Execution time
Number of events processed
Optimization steps
Cost of each processing step
This helps users understand how Splunk executed the search.
Eg-
Search query:
fail OR failed OR password
Using Job Inspector, you can see:
Total events scanned
Time taken to return results
How Splunk optimized the query
Turning Off Optimization
Splunk also allows disabling built-in optimization for testing purposes.
This can be done using the noop command.
Example:
fail OR failed OR password | noop
Purpose:
Compare performance with and without optimization
Identify whether optimization improves or slows down a specific query
Sometimes disabling optimization may give faster results, depending on the query.
Splunk – Transforming Commands
What are Transforming Commands?
Transforming commands in Splunk are used to convert search results into structured tables or statistical summaries.
These commands take the raw event data returned from a search and transform it into formats suitable for reports, statistics, and visualizations such as charts and dashboards.
Instead of showing individual log events, transforming commands produce aggregated results.
Eg.. of Transforming Commands
Some commonly used transforming commands include:
highlight
chart
stats
Highlight Command
The highlight command is used to highlight specific keywords in search results.
It helps users quickly identify important terms in large datasets.
Example:
error | highlight safari,butter
Explanation:
Splunk searches for error events
The words safari and butter are highlighted in the results.
This improves readability and analysis of log events.
Chart Command
The chart command transforms search results into a table format that can be visualized as charts.
Supported visualizations include:
Bar charts
Line charts
Column charts
Area charts
Example:
| chart avg(bytes) by filetype
Explanation:
Calculates average bytes
Groups the results by file type
Results can be displayed as a bar or column chart
This command is commonly used for data visualization in dashboards.
Stats Command
The stats command is one of the most powerful transforming commands in Splunk.
It performs statistical calculations on fields.
Common functions used with stats:
count() – number of events
sum() – total value
avg() – average value
max() – maximum value
min() – minimum value
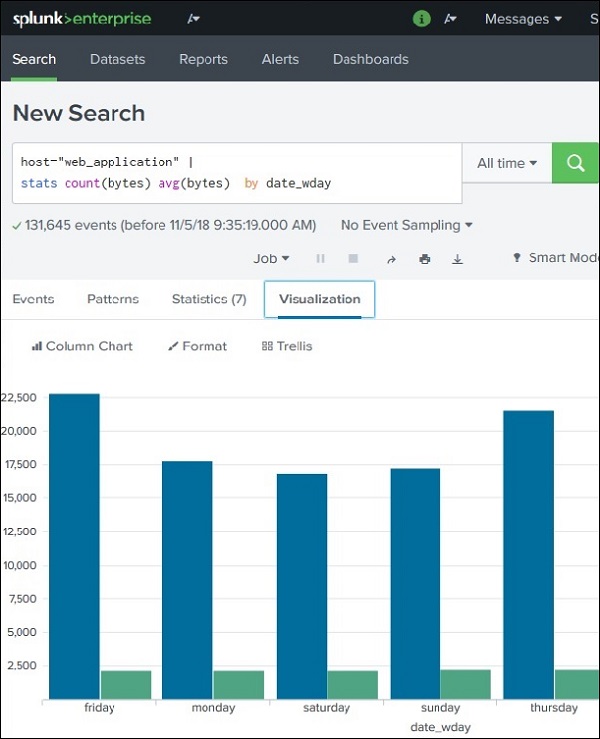
Example:
| stats count by weekday
Explanation:
Counts events
Groups results by weekday
Output example:
Weekday
Count
Monday
20
Tuesday
15
Wednesday
18
This produces summary statistics instead of raw events.
Transforming commands in Splunk convert raw search results into structured statistical data that can be used for reports, charts, and dashboards. Common examples include highlight, chart, and stats.
Splunk – Reports
What is a Splunk Report?
A Splunk Report is a saved result of a search query that displays statistics, tables, or visualizations based on event data.
Key points about reports:
Reports are created from search queries.
They run again each time they are opened, so results are always updated with new data.
Reports can be shared with other users.
They can be added to dashboards.
Some reports support drill-down, allowing users to click on a result and view the underlying events.
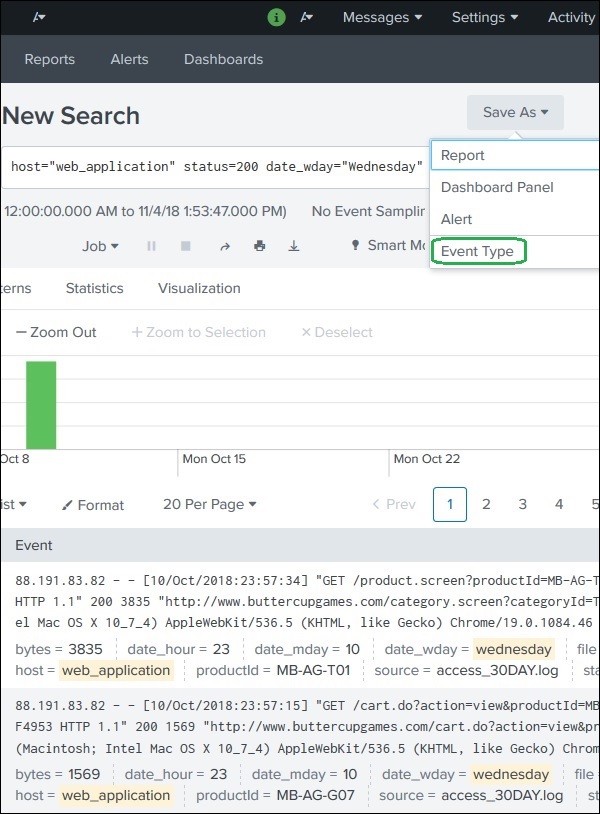
Creating a Report
Creating a report in Splunk is simple.
Steps:
Run a search query in the Search & Reporting app.
Click Save As.
Select Report from the dropdown menu.
This opens the Create Report window.
You must provide:
Report Name
Description
Time Picker option
Time Picker: If enabled, users can change the time range when running the report.
Finally, click Save to create the report.
Report Configuration
After saving the report, Splunk provides options to configure it.
Important configuration options include:
Permissions
Define who can view or edit the report.
Scheduling
You can schedule reports to run automatically at specific intervals.
Example:
Every hour
Every day
Every week
Scheduled reports are often used for monitoring and alerts.
Add to Dashboard
Reports can be added directly to dashboards for visualization.
Viewing a Report
After creating the report, click View to open it.
The report page shows:
Search query results
Charts or tables
Time range selection
Users can run the report again anytime to get updated results.
Modifying the Report Search
Sometimes the original search query needs to be updated.
Steps to edit the search:
Open the report.
Click Open in Search.
The original SPL query appears in the search bar.
Modify the query as needed.
Save the updated report.
A Splunk Report is a saved search result that shows statistics and visualizations. Reports can be scheduled, shared with users, added to dashboards, and updated by modifying the original search query.
Phase 2 : 8AM To 12PM
Splunk - Dashboards
What is a Dashboard in Splunk?
A Dashboard in Splunk is a visual interface that displays data using charts, tables, and reports.
Dashboards are used to monitor systems and analyze data quickly.
Key idea:
A dashboard contains multiple panels.
Each panel displays a report, chart, or table.
This helps present important information in a visually organized way.
Example panels may show:
Login failures
Server activity
Website traffic
System errors
Creating a Dashboard
Dashboards are usually created from search results and visualizations.
Steps to Create a Dashboard
Run a search query in the Search & Reporting app.
Click the Visualization tab.
Choose a chart type (for example Pie Chart).
Click Save As → Dashboard Panel.
This will open the Create Dashboard Panel window.
Filling Dashboard Details
In the next screen you must enter:
Dashboard Title
Panel Title
Dashboard Description
You can either:
Add the panel to an existing dashboard, or
Create a new dashboard
Then click Save.
Viewing the Dashboard
After saving:
Click View Dashboard.
The dashboard will appear with the panel containing your chart.
Dashboard options include:
Edit
Export
Delete
Adding Panels to a Dashboard
Dashboards can contain multiple panels.
To add another panel:
Create another search query and visualization.
Click Save As → Dashboard Panel.
Select the same dashboard.
Add the panel and save.
Now the dashboard will display multiple charts in different panels.
Example:
Panel 1 → Pie chart (file counts by weekday)
Panel 2 → Bar chart (file sizes)
Advanced Dashboard Features
Splunk dashboards also support interactive inputs, such as:
Text boxes
Radio buttons
Dropdown menus
These allow users to filter dashboard data dynamically.
A Splunk Dashboard is a visual display of reports and charts organized into panels. Dashboards help users monitor systems, analyze trends, and present data visually.
Splunk – Pivot and Datasets
What are Datasets in Splunk?
A Dataset in Splunk is a structured collection of data fields, similar to a table in a relational database.
Datasets make it easier to:
Analyze data
Filter records
Create pivot reports
Perform lookups
Build visualizations
Instead of working directly with raw logs, users can work with organized datasets containing selected fields.
Creating a Dataset
Datasets are created using the Splunk Datasets Add-on.
Steps:
Install the Splunk Datasets Add-on from Splunkbase.
Open the add-on in Splunk.
Click Create New Table Dataset.
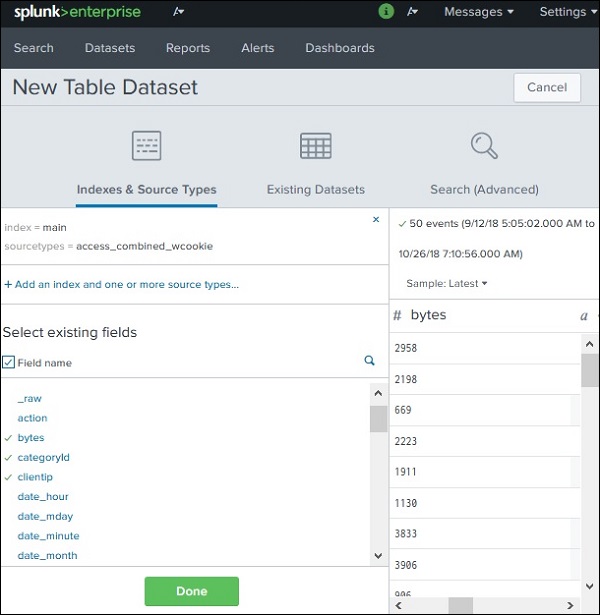
Selecting a Dataset Source
When creating a dataset, Splunk provides three options:
Indexes and Source Types
Use data that already exists in Splunk.
Example:
Logs from servers
Application logs
Network logs
Existing Datasets
Create a new dataset from an existing dataset.
Search
Use the results of a search query as the dataset.
Example:
index=web_logs
In many cases, users select an existing index as the data source.
Choosing Dataset Fields
After selecting the source, Splunk asks which fields should be included in the dataset.
Example fields:
_time (default field – cannot be removed)
bytes
categoryID
clientIP
file
These fields become columns in the dataset table.
After selecting the fields, click Done.
The dataset now looks like a structured table.
Finally, click Save As to store the dataset.
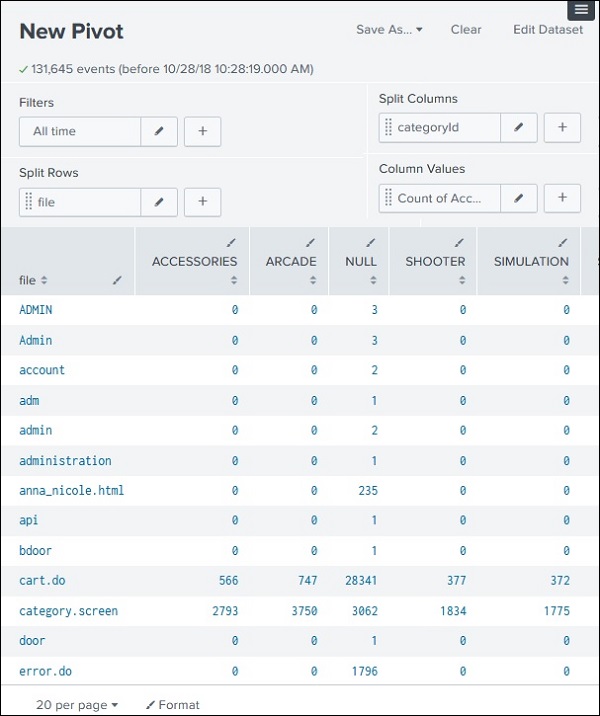
Creating a Pivot
A Pivot is a tool used to summarize and analyze dataset information.
Pivot reports perform aggregation, similar to pivot tables in Excel.
Example:
Count events
Calculate averages
Compare categories
Steps to Create a Pivot
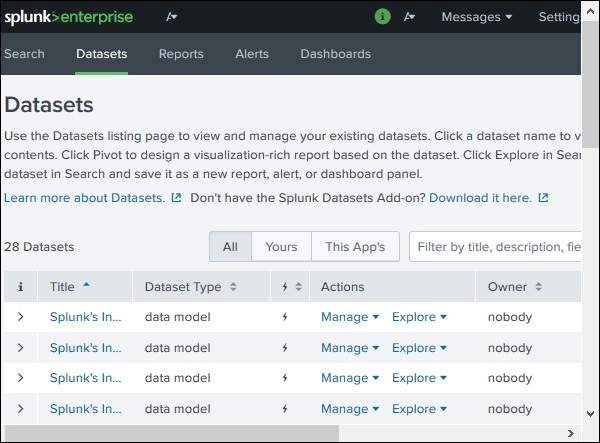
Select Dataset
Go to the Datasets tab and select your dataset.
Choose Pivot Option
Click Actions → Visualize with Pivot.
Select Pivot Fields
In the pivot editor you define:
Split Columns
Field that will appear as columns.
Example:
categoryID
Split Rows
Field that will appear as rows.
Example:
file
Result
The pivot table will show counts of each categoryID for each file.
Example:
File
Category 1
Category 2
Category 3
file1
5
2
3
file2
4
1
6
This allows users to quickly analyze patterns in the data.
Datasets in Splunk are structured tables created from log data.
Pivot is used to analyze datasets by summarizing data across rows and columns.
It helps create reports and visualizations without writing SPL queries.
Splunk – Lookups
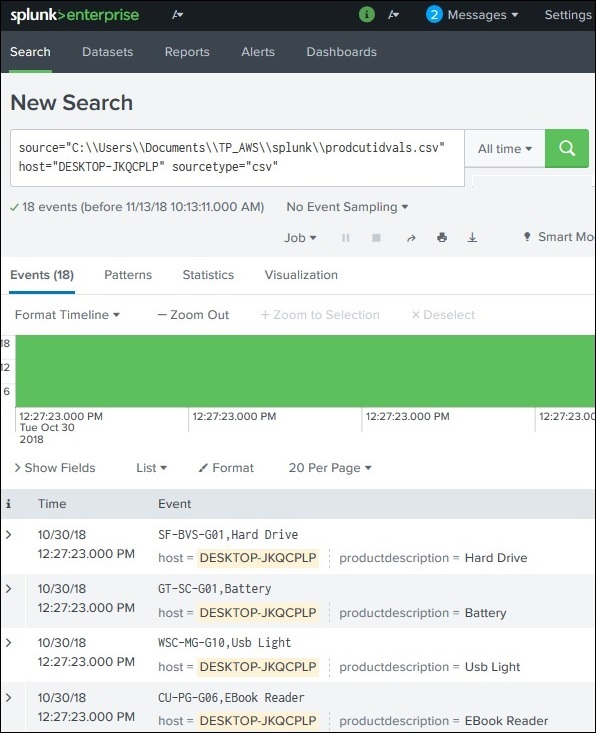
What is a Lookup in Splunk?
A Lookup in Splunk is used to enrich search results by adding additional information from another dataset.
Sometimes log data contains codes or IDs that are not easy to understand. For example:
productid
WC-SH-G04
DB-SG-G01
These values do not clearly explain the product. Using a lookup table, we can map these IDs to meaningful descriptions.
Example lookup result:
productid
productdescription
WC-SH-G04
Tablets
DB-SG-G01
PCs
This process of matching fields from two datasets is called a Lookup.
Steps to Create and Use a Lookup
Create a Lookup File
First, create a CSV file containing the mapping values.
It retrieves the productdescription from the lookup table
The search result will now display product names instead of just IDs.
A Lookup in Splunk is used to add meaningful information to search results by matching fields with values from another dataset (usually a CSV file).
Example:
Product ID → Product Name
IP Address → Location
User ID → User Name
This improves data readability and analysis.
Splunk – Schedules and Alerts
Overview
In Splunk, Scheduling and Alerts help automate monitoring tasks.
Scheduling → Runs reports automatically at specific times.
Alerts → Trigger actions when certain conditions are met in the data.
These features are widely used in system monitoring, security operations, and performance tracking.
Scheduling in Splunk
Scheduling means running a report or search automatically at predefined intervals.
Uses of Scheduling
Run reports daily, weekly, or monthly
Improve dashboard performance by generating results in advance
Automatically send reports via email
Automate system monitoring
Creating a Schedule
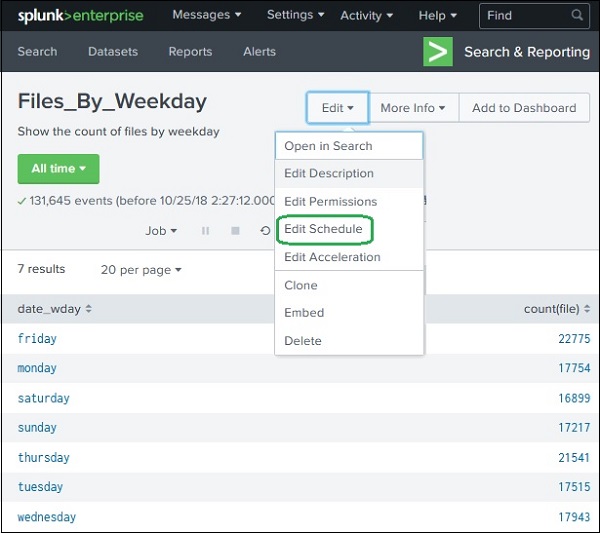
Steps:
Open an existing report.
Click Edit.
Select Edit Schedule.
You will see scheduling options.
Example configuration:
Report runs every Monday at 6 AM.
Important Scheduling Features
Time Range
Defines the data time period used in the report.
Examples:
Last 15 minutes
Last 4 hours
Last week
Schedule Priority
Determines which report runs first when multiple reports are scheduled at the same time.
Higher priority reports run earlier.
Schedule Window
Allows a report to run within a flexible time window.
Example:
If window = 5 minutes
Report may run within 5 minutes of scheduled time
This helps balance system load.
Schedule Actions
After a scheduled report runs, Splunk can perform actions.
Examples:
Send email notification
Run a script
Save results to a file
This is configured using the Add Actions option.
Alerts in Splunk
Alerts are automatic actions triggered when specific conditions occur in search results.
Alerts help detect:
System errors
Security threats
Performance issues
Example:
Alert when login failures exceed 10 attempts
Alert when CPU usage exceeds 90%
Creating an Alert
Steps:
Run a search query.
Click Save As.
Choose Alert.
This opens the Alert Configuration screen.
Alert Configuration Options
Title
Name of the alert.
Description
Explanation of what the alert monitors.
Permissions
Defines who can:
View the alert
Run the alert
Edit the alert
Options:
Private
Shared in App
Alert Type
Two types of alerts:
Scheduled Alert
Runs at specific intervals.
Real-Time Alert
Runs continuously in the background.
Trigger Condition
Defines when the alert should activate.
Examples:
Number of results
Number of hosts
Number of sources
Options include:
Once → trigger once when condition is met
For each result → trigger for every matching event
Trigger Actions
When the alert condition is satisfied, Splunk can perform actions such as:
Send email notification
Log the event
Run a script
Add results to a lookup file
Send webhook notifications
Simple Summary
Scheduling automatically runs reports at defined times.
Alerts trigger actions when specific conditions occur in data.
These features help automate monitoring, notifications, and reporting in Splunk.
Splunk – Knowledge Management
What is Knowledge Management in Splunk?
Knowledge Management (KM) in Splunk is the process of organizing, managing, and sharing knowledge objects so users can better understand and analyze machine data.
It helps transform raw machine data → meaningful information by adding structure, fields, tags, lookups, and data models.
Main Goals of Knowledge Management
1️⃣ Share knowledge objects with the correct users or teams.
Normalize event data by maintaining consistent naming conventions.
Remove duplicate or unused objects.
Improve search and reporting performance.
Create data models for Pivot users.
What is a Knowledge Object?
A Knowledge Object is a Splunk configuration or object that adds meaning to raw data.
When creating a knowledge object, it can be:
Private → only visible to the creator
Shared → accessible by other users or applications
Examples of Knowledge Objects
Saved searches
Field extractions
Lookups
Tags
Event types
Data models
Workflow actions
Uses of Knowledge Objects
When using Splunk regularly, many knowledge objects are created. Without management, this can cause:
Duplicate objects
Confusing naming
Poor data organization
Knowledge Management helps:
Organize objects
Apply permissions
Improve search efficiency
Ensure proper usage across teams
Types of Knowledge Objects
Fields and Field Extractions
Fields are individual pieces of information extracted from raw data.
Example log:
IP=192.168.1.1 user=admin status=failed
Extracted fields:
Field
Value
IP
192.168.1.1
user
admin
status
failed
Two types:
Automatic extraction
Splunk extracts fields automatically.
Manual extraction
User defines custom fields.
These fields help structure raw logs into searchable data.
Event Types and Transactions
Event Types
Used to group similar events together.
Example:
eventtype=login_failure
This may include all logs containing failed login attempts.
Transactions
A transaction groups related events across time.
Example:
User login
File access
Logout
All actions belong to one user session.
Lookups and Workflow Actions
Lookups
Lookups add extra information from external datasets.
Example:
productid
productname
P01
Laptop
Lookup adds productname to search results.
Sources:
CSV files
External scripts
Databases
Workflow Actions
Workflow actions allow interaction with external tools or resources.
Example:
Click an IP address → open WHOIS lookup
Send data to another system
This helps integrate Splunk with other applications.
Tags and Aliases
Tags
Tags are used to group related events or fields.
Example:
Hosts in New York office may all receive tag:
tag=NY_OFFICE
This allows easy filtering.
Aliases
Aliases are used when different field names represent the same data.
Example:
Original Field
Alias
clientip
ipaddress
Now both fields refer to the same information.
This helps normalize data across different sources.
Data Models
A Data Model is a structured representation of datasets.
It helps users analyze data without writing SPL queries.
Data models are mainly used by:
Pivot tool
Dashboards
Reports
Example data model structure:
Web Data ├── User Activity ├── File Access └── Error Logs
Users can easily generate:
Tables
Charts
Reports
Knowledge Management in Splunk organizes and manages objects that give meaning to machine data.
Main knowledge objects include:
Knowledge Object
Purpose
Fields
Extract information from logs
Event Types
Group similar events
Transactions
Link related events
Lookups
Add external data
Tags
Group related fields/events
Aliases
Normalize field names
Data Models
Structured datasets for analysis
Knowledge Management helps convert raw machine data into structured, meaningful, and searchable information in Splunk.
Splunk – Subsearching
What is Subsearch in Splunk?
A Subsearch is a search inside another search where the result of the inner search becomes the input for the outer search.
It is similar to a Subquery in SQL.
Key idea:
Outer Search [ Subsearch ]
Important rule:
The subsearch runs first
Its result is passed to the main (outer) search
Basic Syntax of Subsearch
In Splunk, subsearches are written inside square brackets.
Example structure:
main_search [ subsearch ]
Flow of execution:
Subsearch runs first
It returns results
Those results are used in the main search
Example Scenario
Goal:
Find events where the file size is equal to the maximum file size and occurred on Sunday.
Steps involved:
Find the maximum file size from logs.
Use that value in the main search.
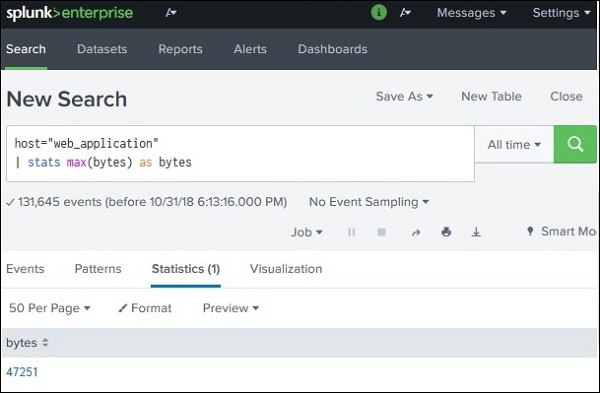
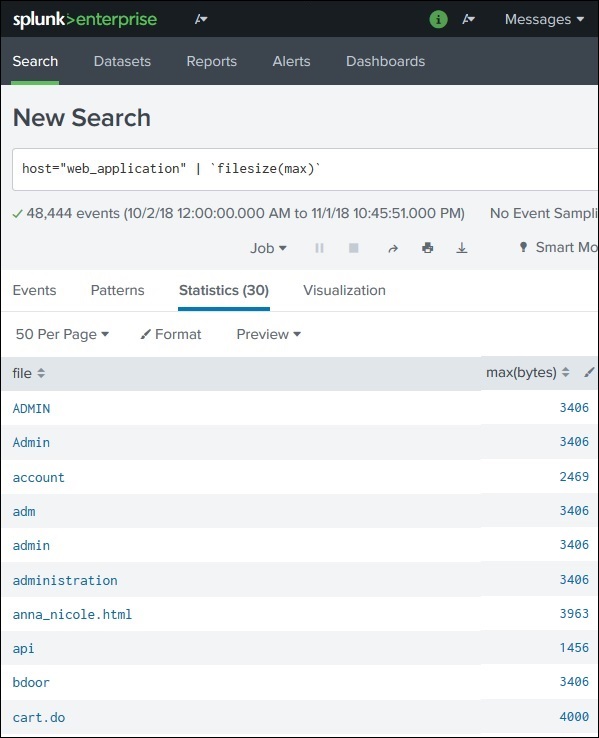
Step 1: Create the Subsearch
We first calculate the maximum file size.
Example:
index=web_application | stats max(bytes)
Explanation:
stats → statistical command
max(bytes) → finds the maximum value of the bytes field
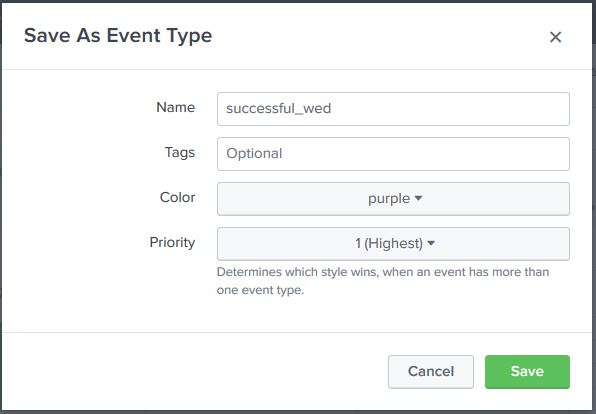
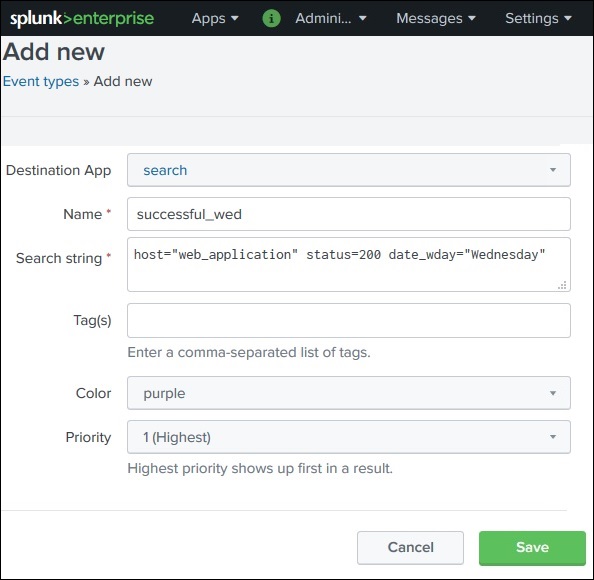
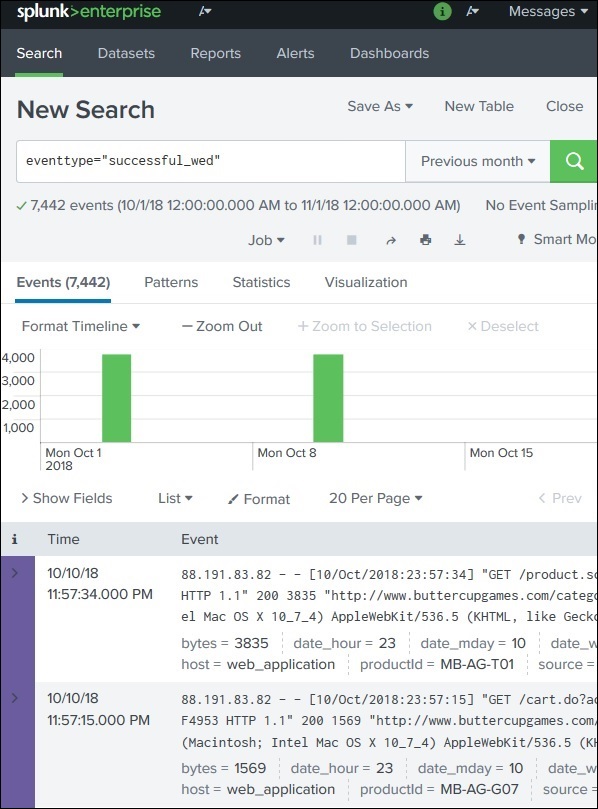
An Event Type is a saved search that groups events based on defined criteria.
Example:
Search condition:
status=200
Event Type created:
status200
Usage:
eventtype=status200
This helps quickly identify and reuse specific types of events in Splunk searches.
Splunk – Basic Chart
What is a Basic Chart in Splunk?
Splunk provides powerful visualization features that convert search results into graphical charts. These charts help users analyze trends, patterns, and statistics visually.
Charts are created from search queries that produce numerical or statistical results.
Example data source:
index=web_application
Example goal:
Find average file size (bytes) and display it as a chart.
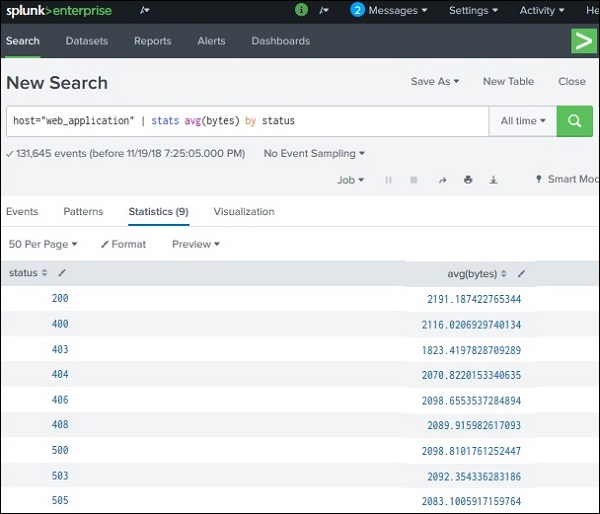
Step 1: Generate Statistical Data
Before creating a chart, the search must produce statistical output.
Example SPL query:
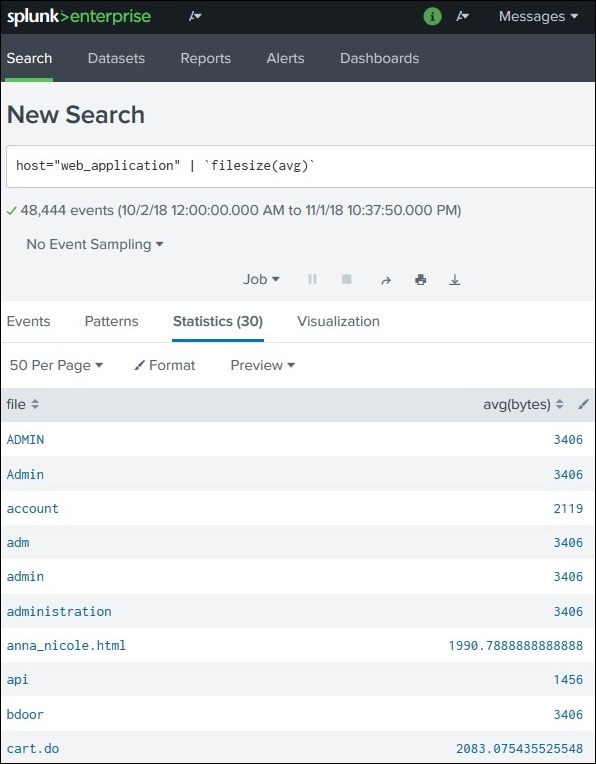
index=web_application | stats avg(bytes) by file
Result appears in the Statistics tab.
Example output:
file
avg(bytes)
file1.html
520
file2.jpg
1200
file3.png
980
This statistical data becomes the input for chart visualization.
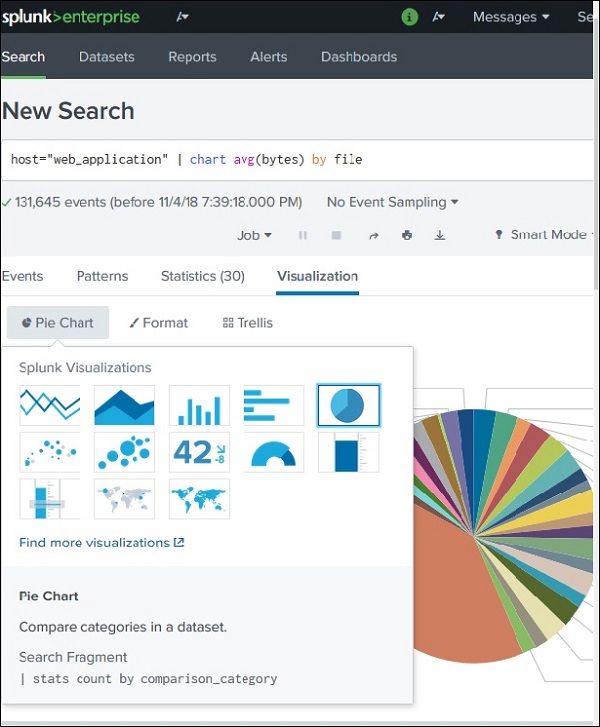
Step 2: Create the Chart
Steps:
Run the search query.
Open the Statistics tab to confirm the data.
Click the Visualization tab.
Splunk automatically creates a default chart, usually a Pie Chart.
Example visualization:
Each file represented as a slice
Slice size based on average bytes
Step 3: Change Chart Type
Splunk allows multiple chart types.
Common chart options include:
Chart Type
Purpose
Pie Chart
Shows proportions
Bar Chart
Compares values
Column Chart
Displays grouped comparisons
Line Chart
Shows trends over time
Area Chart
Displays cumulative trends
Example:
Switching from Pie Chart → Bar Chart makes file sizes easier to compare.
Step 4: Formatting the Chart
Splunk also allows customizing the chart appearance.
Click Format to modify chart settings.
Formatting options include:
Axes Settings
Control labels and scale of:
X-axis
Y-axis
Legends
Legends describe what each color or value represents.
Example:
Blue → file1.html Green → file2.jpg
Data Labels
Display actual numerical values on the chart.
Example:
file1.html → 520 bytes file2.jpg → 1200 bytes
Chart Orientation
Example:
Vertical bar chart
Horizontal bar chart
Horizontal charts are often easier to read when many values exist.
Example Full SPL Query
Example search generating chart data:
index=web_application | stats avg(bytes) by file
Visualization output:
Bar chart showing average file size per file
Advantages of Charts in Splunk
✔ Easy data visualization ✔ Identify trends quickly ✔ Improve dashboards ✔ Better data analysis ✔ Useful for reports and presentations
Simple Summary
A Basic Chart in Splunk converts statistical search results into visual graphs.
Steps:
Run search with statistical function
View results in Statistics tab
Open Visualization tab
Choose chart type
Format chart if needed
Example SPL:
index=web_application | stats avg(bytes) by file
This can be visualized as:
Pie chart
Bar chart
Line chart
Splunk – Overlay Chart
What is an Overlay Chart?
An Overlay Chart in Splunk is used to display one chart on top of another so that multiple metrics can be compared in the same visualization.
Typically:
One metric is shown as bars or columns
Another metric is shown as a line overlay
This helps identify patterns, correlations, and trends between datasets.
Example comparison:
File size vs Average file size
Sales vs Average sales
Network traffic vs Standard deviation
Example Scenario
Suppose we want to analyze file sizes from web application logs across different days of the week.
We calculate:
1️⃣ Total bytes 2️⃣ Average bytes 3️⃣ Standard deviation of bytes
These metrics help understand file size distribution.
Step 1: Create the Base Chart
First create a chart with two metrics.
Example SPL query:
index=web_application | stats sum(bytes) as total_bytes avg(bytes) as avg_bytes by weekday
Example statistical output:
weekday
total_bytes
avg_bytes
Monday
12000
800
Tuesday
15000
900
Wednesday
17000
950
This data can be visualized as a bar chart.
Step 2: Add a Third Variable
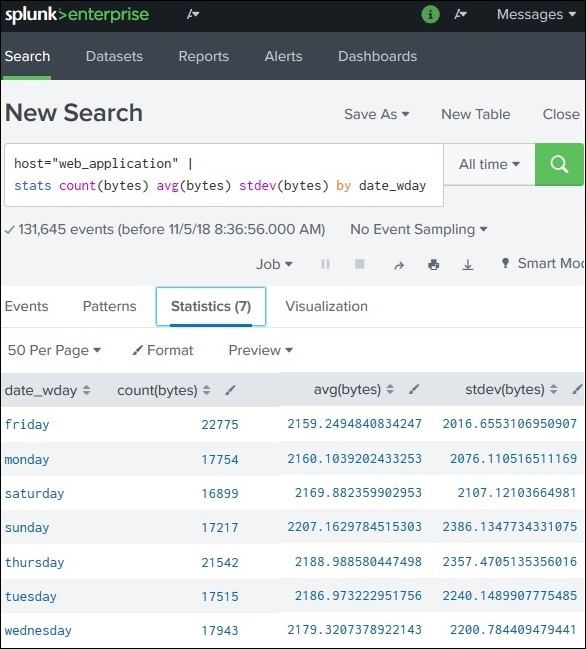
To create an overlay chart, add another statistical measure such as standard deviation.
Example updated query:
index=web_application | stats sum(bytes) avg(bytes) stdev(bytes) by weekday
Now the statistics tab contains:
weekday
sum(bytes)
avg(bytes)
stdev(bytes)
Monday
12000
800
150
Tuesday
15000
900
200
Wednesday
17000
950
220
This extra field enables the overlay visualization.
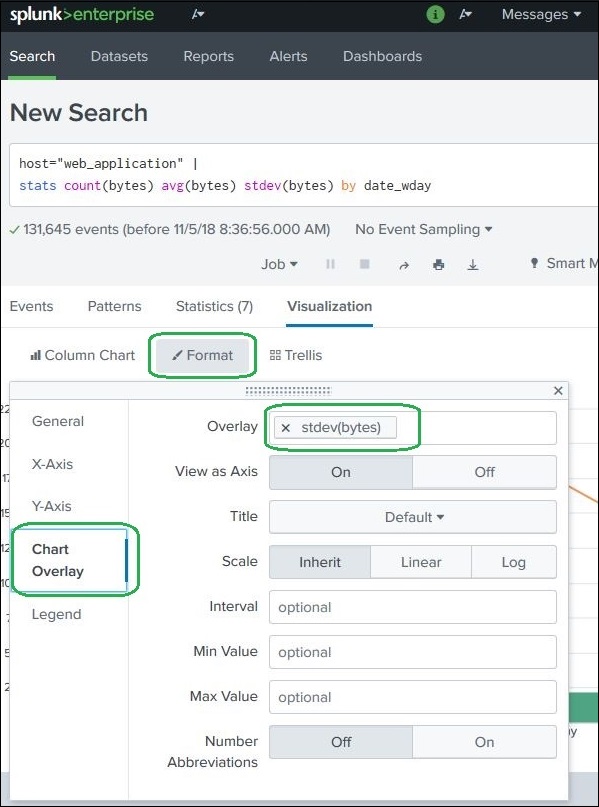
An Overlay Chart in Splunk displays two charts together in one visualization.
Steps:
1️⃣ Create a chart with statistical values 2️⃣ Add a third metric 3️⃣ Use Visualization → Format → Chart Overlay 4️⃣ Select the overlay field
Example SPL query:
index=web_application | stats sum(bytes) avg(bytes) stdev(bytes) by weekday
This helps compare main metrics with trend indicators in the same chart.
Splunk - Sparklines
What are Sparklines?
A Sparkline is a small, compact chart that shows trends over time inside a table cell. Unlike normal charts, sparklines do not display axes or labels. They appear as tiny line graphs that show how a value changes over time.
They are useful for quickly understanding trends or fluctuations in data.
Example idea:
File
Avg Bytes
Trend
file1.html
800
▁▃▅▇
file2.jpg
1200
▂▆▃▇
The small graph indicates how the value changed over time.
Why Sparklines Are Used
Sparklines help:
Show data trends inside tables
Save dashboard space
Quickly identify patterns
Compare multiple trends simultaneously
They are commonly used in monitoring dashboards and reports.
Step 1: Select the Fields
First, run a search that produces statistical values.
Example SPL query:
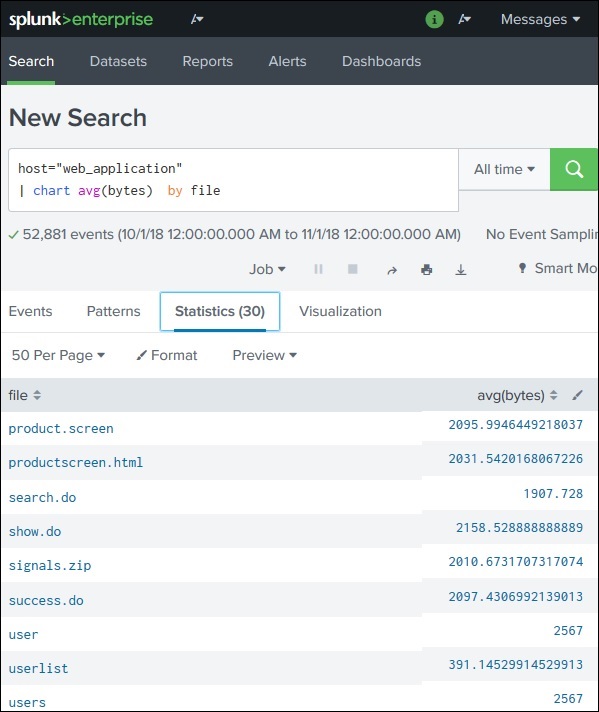
index=web_application | stats avg(bytes) by file
Result example:
file
avg(bytes)
file1.html
820
file2.jpg
1200
file3.png
950
This statistical data will be used to create the sparkline.
Step 2: Create the Sparkline
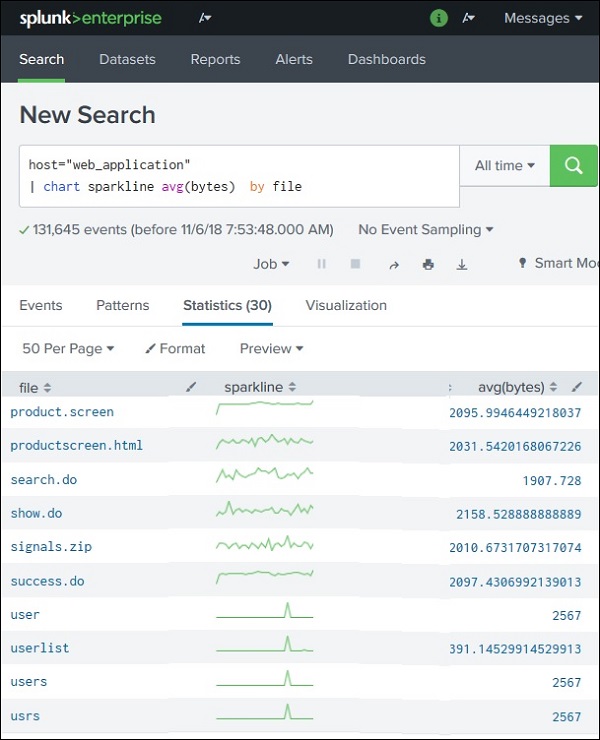
To generate sparklines, use the sparkline() function with the stats command.
Example query:
index=web_application | stats sparkline(avg(bytes)) as trend avg(bytes) by file
Result:
file
avg(bytes)
trend
file1.html
820
tiny graph
file2.jpg
1200
tiny graph
file3.png
950
tiny graph
Each row now shows a mini trend graph representing changes in average bytes.
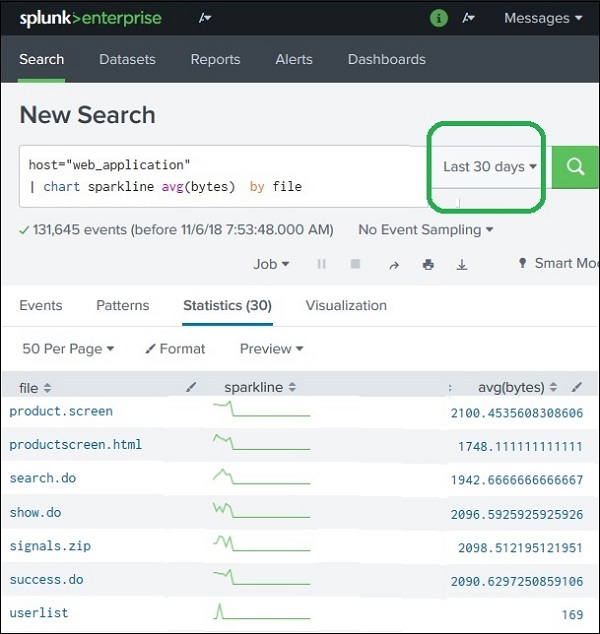
Step 3: Time Range Effect
The sparkline graph depends on the selected time range.
Example:
Time Range: All Time
The sparkline displays the trend for the entire dataset.
Time Range: Last 30 Days
Only data from the last 30 days is used.
Effects:
Some files may disappear if they were not present in that period.
The sparkline shape changes based on recent trends.
Example Full Query
Example SPL query with sparkline:
index=web_application | stats sparkline(avg(bytes)) as trend avg(bytes) by file
Explanation:
Command
Purpose
stats
Generates statistical results
avg(bytes)
Calculates average file size
sparkline()
Generates mini trend chart
Advantages of Sparklines
✔ Shows trends in a compact format ✔ Works inside tables and dashboards ✔ No extra chart space required ✔ Useful for monitoring and comparisons
Real-World Use Cases
Sparklines are commonly used for:
Use Case
Example
Server Monitoring
CPU usage trend
Network Monitoring
Traffic fluctuation
Security Monitoring
Login attempts over time
Business Analytics
Sales trend per product
Simple Summary
A Sparkline in Splunk is a small trend chart displayed inside a table cell.
Key points:
Shows data trends over time
Does not include axes or labels
Created using sparkline() function
Example SPL:
index=web_application | stats sparkline(avg(bytes)) as trend avg(bytes) by file
This displays mini trend charts for each file.
Splunk – Managing Indexes
What is an Index in Splunk?
An Index in Splunk is a storage location where processed machine data is stored and organized for fast searching.
Indexing works similar to database indexing, where data is given structured references so searches can be executed quickly.
When data enters Splunk:
The Indexer processes the data
Data is stored in an index
Searches retrieve data from those indexes
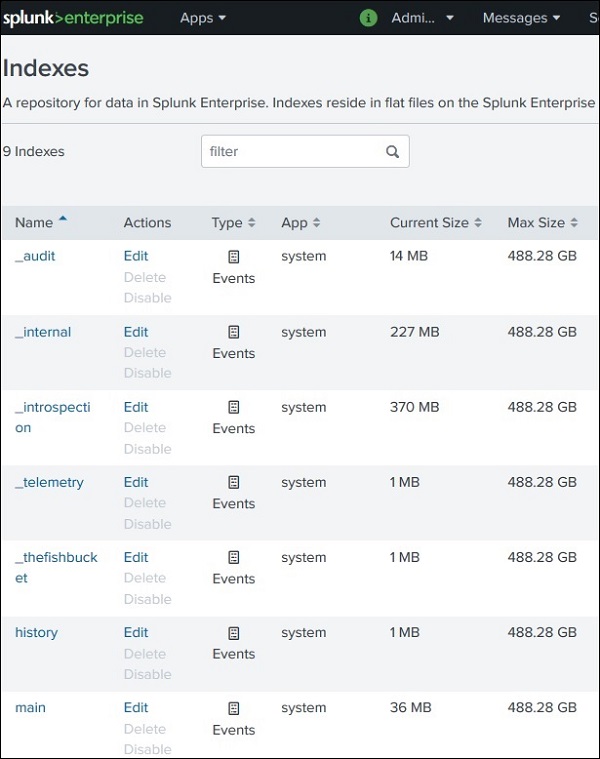
Default Indexes in Splunk
When Splunk is installed, it automatically creates three default indexes.
Index Name
Purpose
main
Default index where most ingested data is stored
internal
Stores Splunk system logs and performance metrics
audit
Stores user activity and audit logs
Example Search Using an Index
Example SPL:
index=main
This searches events stored in the main index.
Example:
index=_internal
This searches Splunk system logs.
Role of the Indexer
The Indexer component in Splunk is responsible for:
Processing incoming data
Creating indexes
Storing events in indexed format
Enabling fast search operations
So the flow is:
Data → Indexer → Index → Search
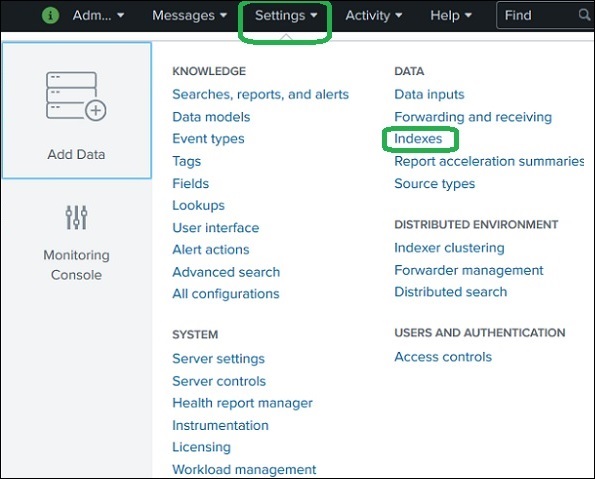
Checking Existing Indexes
You can view available indexes in Splunk.
Steps:
Login to Splunk Web Interface
Go to Settings
Click Indexes
This displays a list of:
Default indexes
Custom indexes
Storage usage
Data size
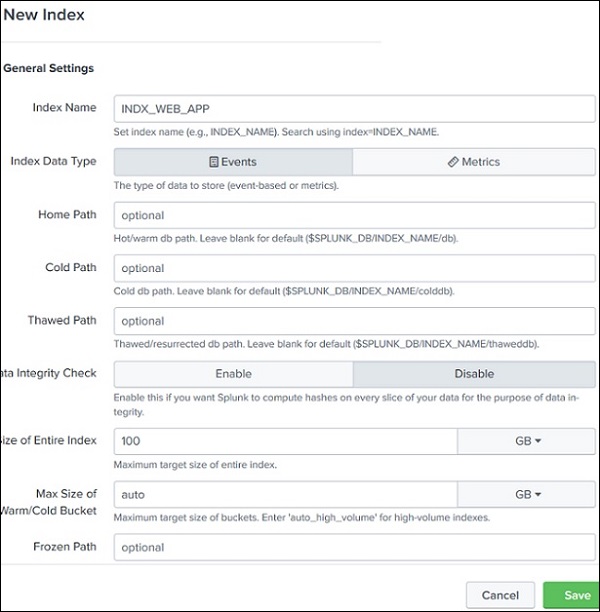
Creating a New Index
Sometimes you may want to separate different types of data into different indexes.
Example reasons:
Security logs
Web application logs
Network logs
Steps to create an index:
Go to Settings
Click Indexes
Click New Index
You will see a configuration screen.
Required Information
Field
Description
Index Name
Name of the new index
Storage Path
Location where data is stored
Max Size
Maximum storage allocation
Data Retention
Time period for storing data
Example:
index_web_app
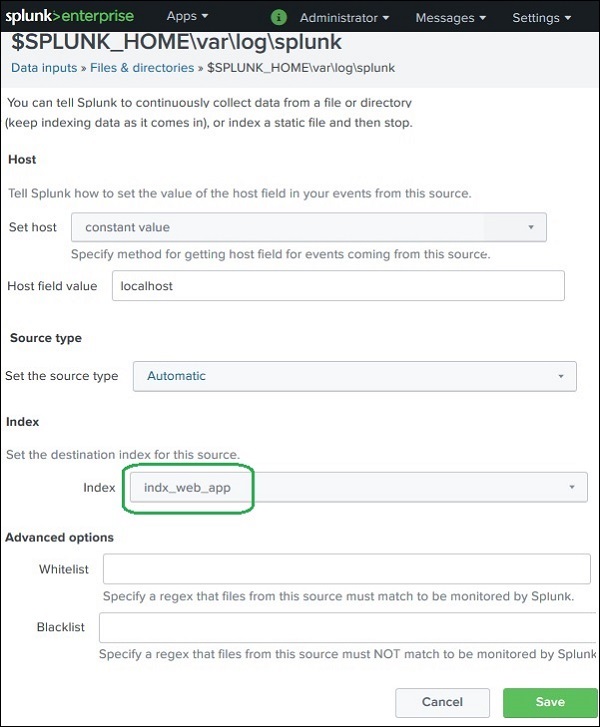
Assigning Data to an Index
After creating an index, new data must be configured to use that index.
Steps:
Go to Settings
Select Data Inputs
Choose Files & Directories
Select the data source
Assign the new index
Example:
index = index_web_app
Now all events from that data source will be stored in the new index.
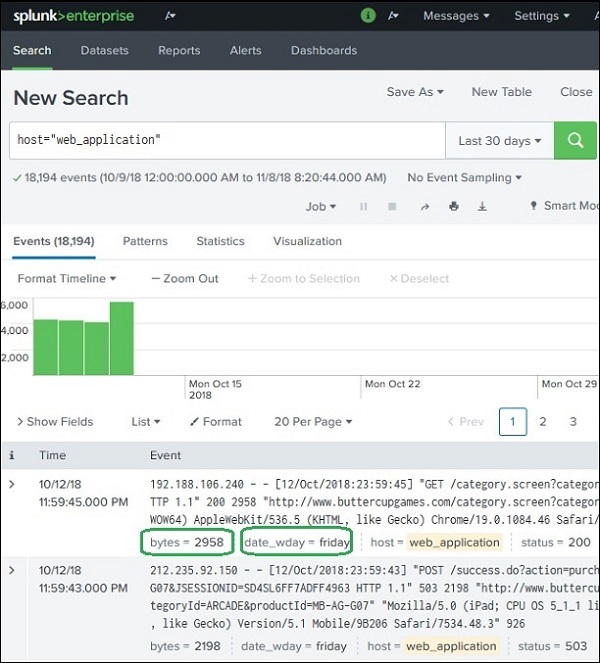
Example Search with Custom Index
Example SPL query:
index=index_web_app
This searches only the data stored in the custom index.
Advantages of Using Multiple Indexes
✔ Better data organization ✔ Faster searches ✔ Easier data management ✔ Separate storage for different log types ✔ Improved security control
Example:
Index
Data Type
web_logs
Website logs
security_logs
Security events
system_logs
Server logs
Simple Summary
An Index in Splunk is a structured storage location for processed machine data.
Key points:
Indexing improves search performance
Default indexes include main, internal, and audit
New indexes can be created for better data management
Data sources can be assigned to specific indexes
Example SPL:
index=main
This searches events stored in the main index.
Splunk – Calculated Fields
What are Calculated Fields?
Calculated Fields in Splunk are new fields created by applying calculations or transformations to existing fields in events.
They are useful when you want to:
Modify existing data
Convert values to another unit
Extract part of a field
Create new derived information
These calculations are usually done using the eval command in SPL.
Why Calculated Fields Are Used
Calculated fields help:
Perform mathematical calculations
Transform data formats
Extract specific parts of a field
Create new analytical fields
Example uses:
Original Field
Calculated Field
bytes
bytes_in_GB
date_wday
short_day
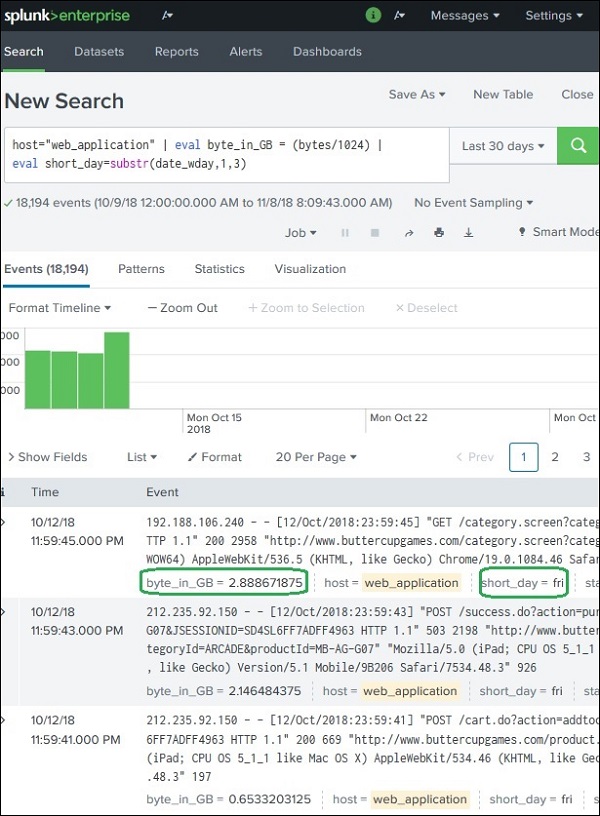
Example Scenario
Suppose the web_application log contains the following fields:
bytes
date_wday
2048
Wednesday
4096
Thursday
1024
Monday
Goals:
1️⃣ Convert bytes → GB 2️⃣ Show only the first three characters of the weekday
Using the evalFunction
Splunk uses the eval command to create calculated fields.
Tags are labels used to group specific field–value combinations in Splunk events.
They allow you to categorize events so that they can be searched easily with a single keyword instead of writing complex queries.
Tags are part of Splunk Knowledge Objects.
Why Tags Are Used
Tags help to:
Organize events
Simplify searches
Group similar field values
Improve data classification
Example:
Instead of searching multiple status codes:
status=503 OR status=505
You can create a tag called:
server_error
Then simply search:
tag=server_error
Fields That Can Be Tagged
Tags can be assigned to different Splunk fields such as:
Field Type
Example
host
server01
source
web_log
sourcetype
apache_access
event type
status events
field-value pairs
status=503
Example Scenario
Suppose we want to group server error status codes.
Error status codes:
503 505
We assign them the tag:
server_error
So:
Field
Value
Tag
status
503
server_error
status
505
server_error
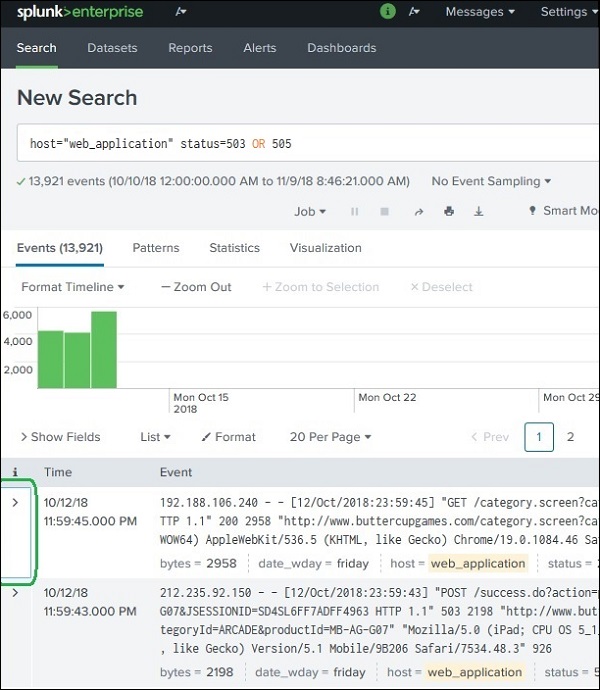
Steps to Create Tags
Step 1 – Expand Event
Run a search
Expand an event
View the field list
Example field:
status=503
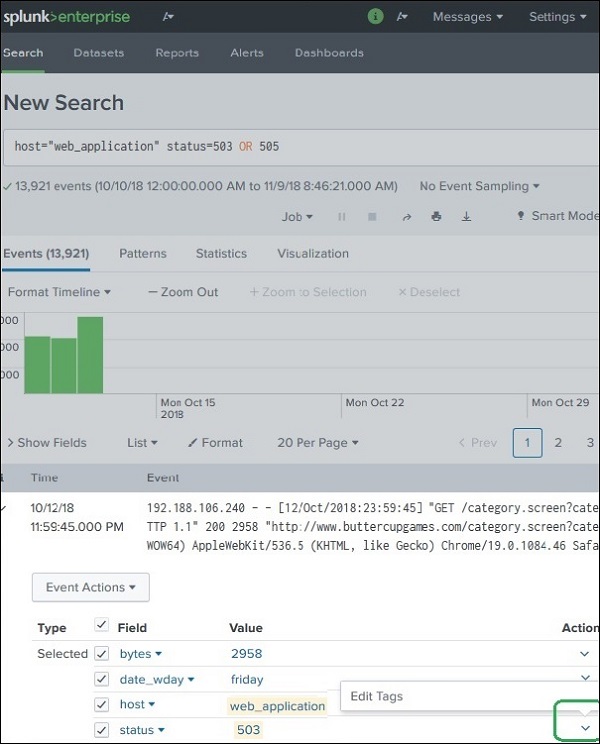
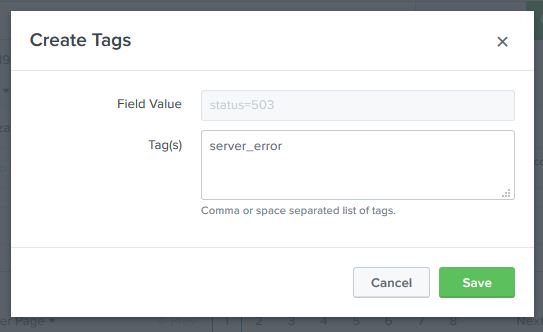
Step 2 – Edit Tag
Locate the field
Click Actions
Select Edit Tags
Step 3 – Add Tag Name
Enter the tag name.
Example:
server_error
Apply this tag to:
status=503 status=505
You must repeat the step for each value.
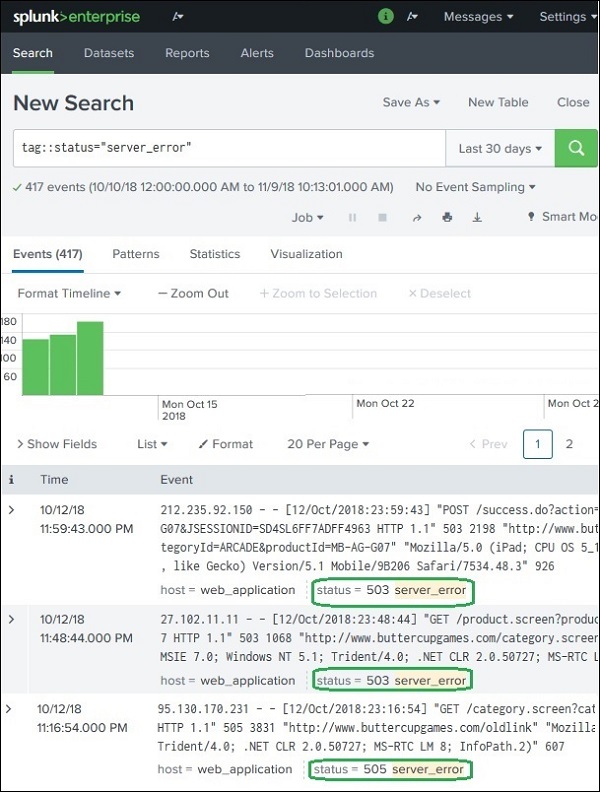
Searching Using Tags
Once tags are created, searching becomes easier.
Example Search
tag=server_error
This will return events containing:
status=503 status=505
Even though the search does not explicitly mention them.
Example Comparison
Without Tag
status=503 OR status=505
With Tag
tag=server_error
Tags make the query simpler and reusable.
Tags vs Fields
Feature
Tags
Fields
Purpose
Group field values
Store event data
Usage
Simplify searches
Extract event information
Example
server_error
status=503
Advantages of Tags
✔ Simplifies complex searches ✔ Groups multiple field values ✔ Improves data categorization ✔ Helps in knowledge management ✔ Useful for dashboards and reports
Simple Summary
A Tag in Splunk is a label assigned to field-value combinations to group similar events.
Example:
status=503 status=505
Tagged as:
server_error
Search query:
tag=server_error
This returns all events that match those tagged values.
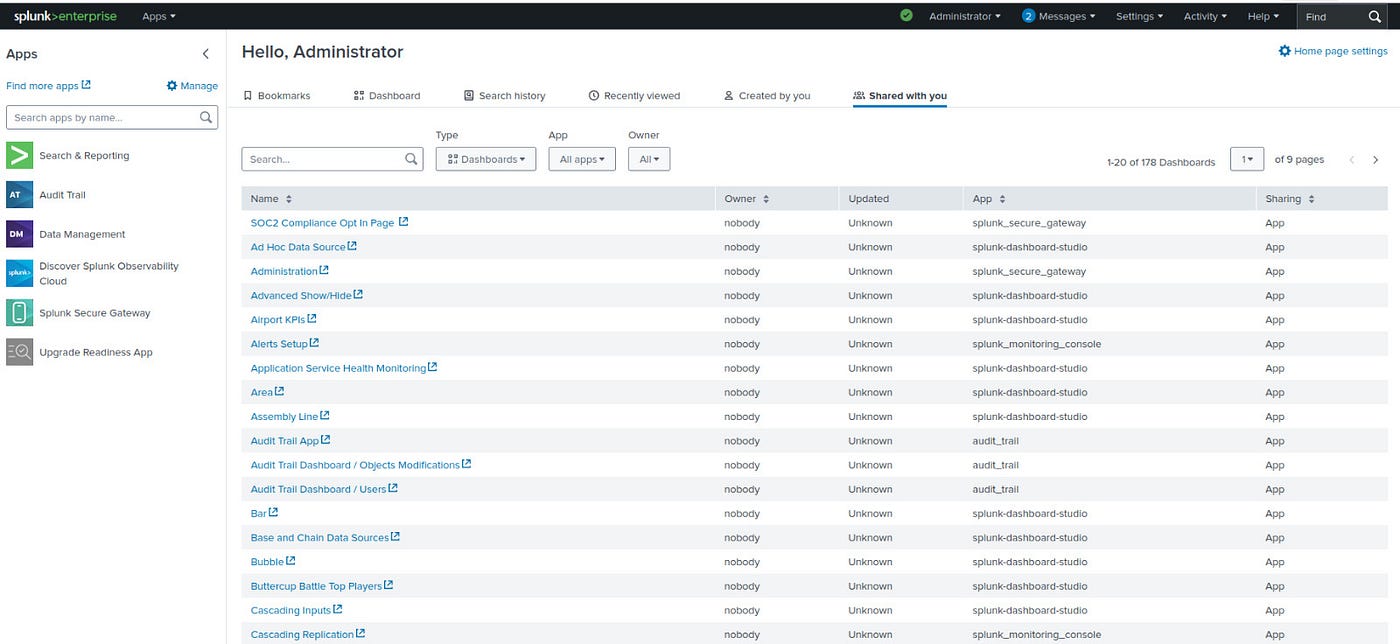
What are Apps in Splunk?
Splunk Apps are packages that extend the functionality of Splunk. They contain configurations, dashboards, reports, searches, field extractions, and visualizations designed for specific use cases.
Apps help users analyze specific types of data quickly without building everything from scratch.
Components of a Splunk App
A Splunk App may contain several components:
Component
Description
Dashboards
Visual displays of data
Reports
Saved searches with results
Alerts
Notifications triggered by conditions
Field Extractions
Extract fields from raw data
Data Models
Structured data representation
Lookups
External reference data
These components work together to provide a complete monitoring or analysis solution.
Examples of Popular Splunk Apps
Some commonly used apps include:
App Name
Purpose
Splunk App for AWS
Monitor Amazon Web Services
Splunk App for Windows Infrastructure
Monitor Windows systems
Splunk App for Unix and Linux
Monitor Linux servers
Splunk Security Essentials
Security analytics
Splunk IT Service Intelligence (ITSI)
IT service monitoring
These apps are usually downloaded from Splunkbase, the official marketplace.
Installing Splunk Apps
There are two common ways to install apps.
Method 1 – From Splunkbase
Steps:
Go to Apps → Find More Apps
Search for the desired app
Click Install
Provide Splunkbase credentials
Method 2 – Manual Installation
Steps:
Download the app from Splunkbase
Go to Apps → Manage Apps
Click Install App from File
Upload the .spl or .tgz package
Managing Installed Apps
You can manage apps using:
Settings → Manage Apps
From here you can:
Enable or disable apps
Upgrade apps
Configure permissions
Remove apps
Example: Using an App
Suppose you install Splunk App for AWS.
The app automatically provides:
AWS dashboards
Cloud monitoring reports
Prebuilt searches
Alerts for cloud resources
This saves time compared to building everything manually.
Advantages of Splunk Apps
✔ Ready-to-use dashboards and reports ✔ Faster deployment for monitoring systems ✔ Easy integration with external platforms ✔ Customizable for specific business needs ✔ Extend Splunk capabilities
Types of Splunk Apps
Type
Description
Technology Add-ons (TA)
Data collection and field extraction
Visualization Apps
Custom dashboards
Security Apps
Security monitoring
Infrastructure Apps
Server and cloud monitoring
Simple Summary
A Splunk App is a packaged extension that adds dashboards, reports, alerts, and configurations to Splunk.
Example:
Apps → Install → Use dashboards & reports
They help users analyze specific data sources quickly and efficiently.
Splunk – Removing Data
What Does Removing Data Mean in Splunk?
In Splunk, removing data means deleting indexed events from the system so they are no longer searchable.
However, Splunk does not normally delete individual events easily because data is stored in indexed buckets for fast searching. Instead, data removal usually happens by:
Deleting specific events using commands
Deleting entire indexes
Using data retention policies
Methods to Remove Data in Splunk
There are mainly three ways to remove data.
Method
Description
Using the delete command
Removes specific search results
Deleting an index
Removes all events stored in that index
Data retention policy
Automatically removes old data
1. Removing Events Using the deleteCommand
Splunk provides a delete command that marks events as deleted.
Example Search
index=main host=server1 | delete
This command:
Finds events from host=server1
Marks them as deleted
Important points:
Events are not physically removed immediately
They are hidden from search results
To use the delete command, the role must have can_delete permission.
2. Removing Data by Deleting an Index
If you want to remove all data, you can delete the entire index.
Steps:
Go to Settings
Click Indexes
Select the index
Delete or remove it
Example index:
index_web_logs
Deleting the index removes all events stored in that index.
3. Removing Data Using Data Retention Policies
This is the most common method in production environments.
✔ Saves storage space ✔ Maintains system performance ✔ Ensures compliance with data policies ✔ Prevents unnecessary data accumulation
Simple Summary
Removing data in Splunk means deleting events from indexes.
Main methods:
1️⃣ Using delete command
index=main host=server1 | delete
2️⃣ Deleting an index
3️⃣ Using automatic data retention policies
Splunk – Custom Chart
What is a Custom Chart in Splunk?
A Custom Chart in Splunk is a user-defined visualization created to display data in a specific way that is not available in the default chart options.
Splunk provides basic charts such as:
Pie chart
Bar chart
Line chart
Area chart
Column chart
But sometimes organizations need specialized visualizations, which can be created using custom chart modules or visualization apps.
Why Custom Charts Are Used
Custom charts are used when:
Default Splunk charts are not sufficient
Special visualization is required
Advanced dashboards are needed
Interactive analytics is required
Examples include:
Heat maps
Radar charts
Sankey diagrams
Advanced timelines
Creating a Custom Chart
To create a custom chart in Splunk:
Step 1 – Run a Search Query
First run a search that produces statistical data.
Example:
index=web_application | stats avg(bytes) by file
This produces a table like:
file
avg(bytes)
file1
2048
file2
4096
Step 2 – Open Visualization Tab
After the results appear:
Click Visualization
Choose Chart Type
Splunk will display a default chart such as pie chart or bar chart.
Step 3 – Customize the Chart
Use the Format option to modify:
Setting
Purpose
Axis labels
Label X and Y axes
Legend
Display chart legends
Data labels
Show values on chart
Colors
Customize appearance
Chart title
Add meaningful title
Using Custom Visualization Apps
Splunk also supports custom visualization apps from Splunkbase.
Examples:
Visualization
Use Case
Sankey Diagram
Data flow analysis
Heat Map
Density analysis
Bubble Chart
Multivariable comparison
Gauge Chart
Performance monitoring
These visualizations can be installed via:
Apps → Find More Apps → Install Visualization
Example Custom Chart Query
Example SPL:
index=web_application | stats avg(bytes) by date_wday
Visualization result:
Day
Avg Bytes
Monday
3000
Tuesday
2500
Wednesday
3500
This can be displayed as:
Bar chart
Line chart
Custom visualization
Advantages of Custom Charts
✔ Better data visualization ✔ More meaningful dashboards ✔ Supports advanced analytics ✔ Improves decision making ✔ Highly customizable
Simple Summary
A Custom Chart in Splunk is a specialized visualization created using search results and advanced chart configuration.
Steps:
1️⃣ Run search query 2️⃣ Open Visualization tab 3️⃣ Choose chart type 4️⃣ Customize using Format options
Example SPL:
index=web_application | stats avg(bytes) by file
Splunk - Monitor Files
What is File Monitoring in Splunk?
File Monitoring in Splunk means tracking files or directories for new data and automatically indexing that data.
When new data is written to a monitored file (such as log files), Splunk reads the new entries and adds them to its index so they can be searched and analyzed.
This is commonly used for application logs, server logs, and system logs.
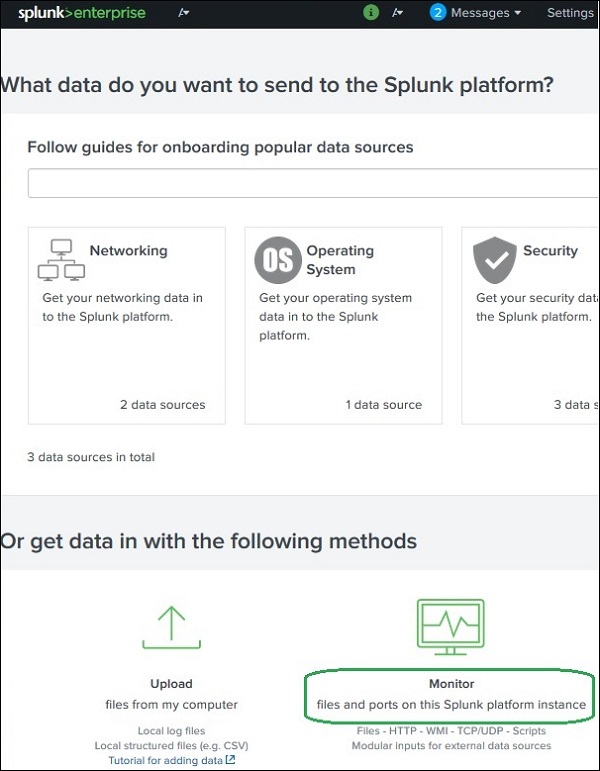
How Splunk Monitors Files
Splunk uses a monitor input to watch files or directories.
Process:
User specifies file or directory path
Splunk reads the file
When new data appears, Splunk indexes it automatically
Example:
/var/log/apache/access.log
Whenever new logs appear in this file, Splunk captures and indexes them.
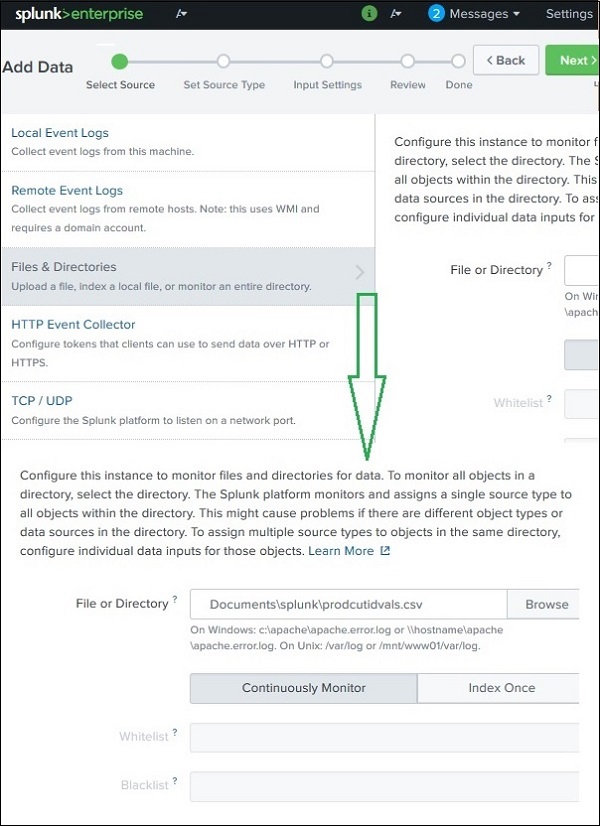
Monitoring Directories
Instead of monitoring a single file, you can monitor a complete directory.
Example:
/var/log/apache/
If the directory contains subdirectories, Splunk can also monitor them recursively.